

Question: Graph the given function using a chart of values. (Use -3 x 3.) g(x) = 8(3x) 200 y 100 autosave#question3969792_2 y 200 100 X
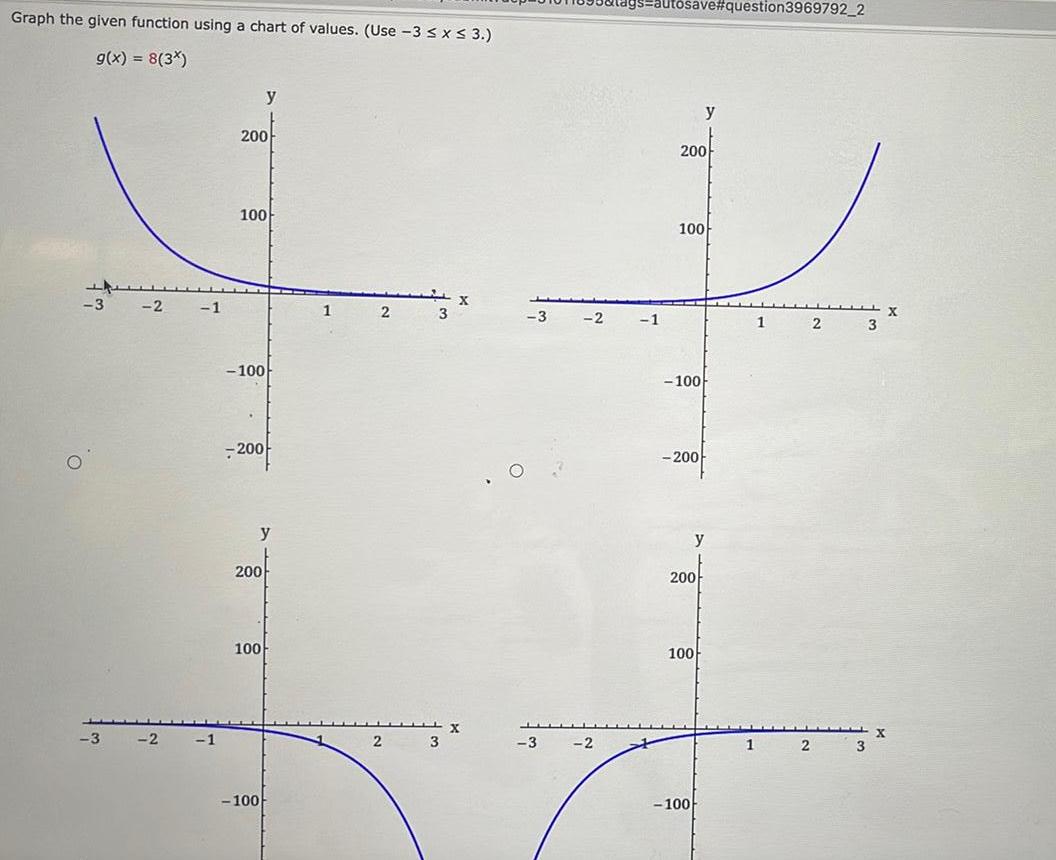
Graph the given function using a chart of values. (Use -3 x 3.) g(x) = 8(3x) 200 y 100 autosave#question3969792_2 y 200 100 X -3 -2 -1 1 2 3 -3 -2 -1 1 2 3 -3 -2 -1 -100 -200 y 200 100 -100 2 3 -3 -2 -100 -200 y 200- 100 -100 1 2 3
Step by Step Solution
There are 3 Steps involved in it
1 Expert Approved Answer
Step: 1 Unlock

Question Has Been Solved by an Expert!
Get step-by-step solutions from verified subject matter experts
Step: 2 Unlock
Step: 3 Unlock