

Question: Graph the logarithmic function g (x) = log, (x-1) -3. To do this, plot two points on the graph of the function, and also draw

![the domain and range of the function using interval notation. X(0,0) [0,0]](https://s3.amazonaws.com/si.experts.images/answers/2024/06/6666350fb5a54_2876666350f933d8.jpg)
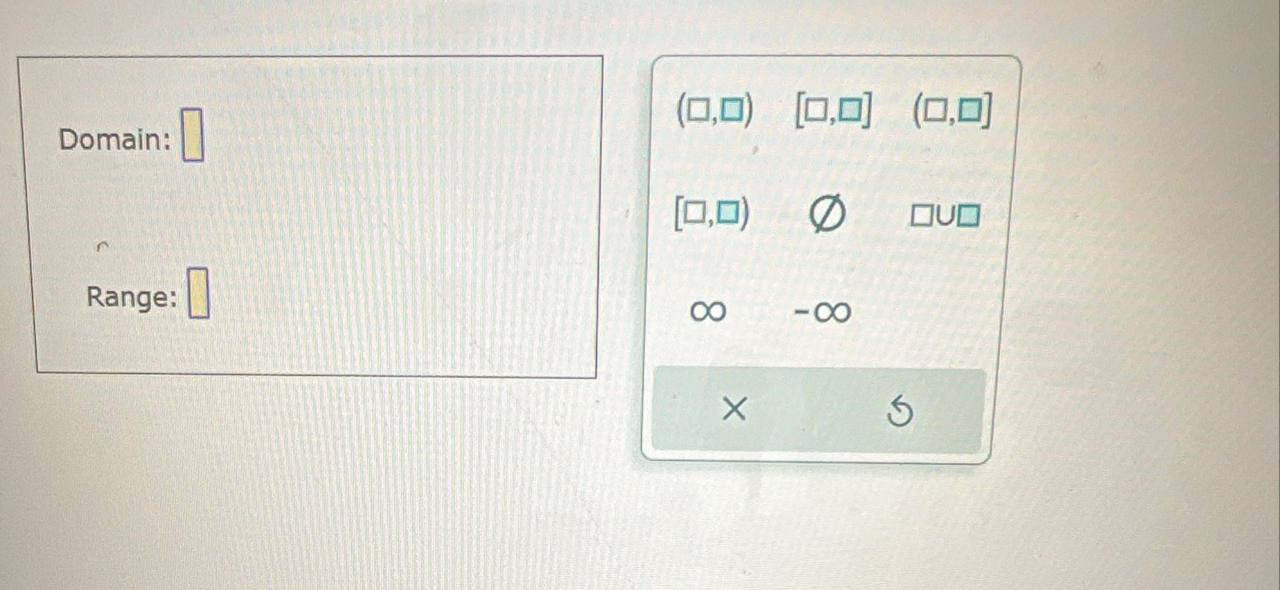
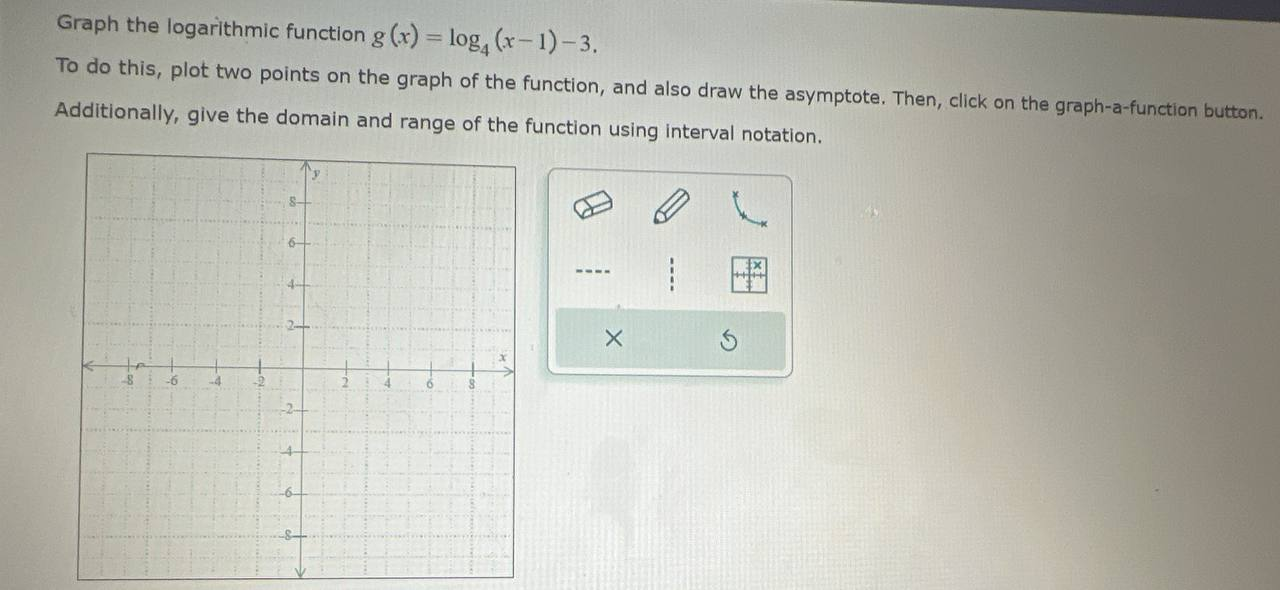
Graph the logarithmic function g (x) = log, (x-1) -3. To do this, plot two points on the graph of the function, and also draw the asymptote. Then, click on the graph-a-function button. Additionally, give the domain and range of the function using interval notation. X(0,0) [0,0] (0,0] Domain: [0,0) 0 DUD Range: OO -OO X 5
Step by Step Solution
There are 3 Steps involved in it
1 Expert Approved Answer
Step: 1 Unlock

Question Has Been Solved by an Expert!
Get step-by-step solutions from verified subject matter experts
Step: 2 Unlock
Step: 3 Unlock