

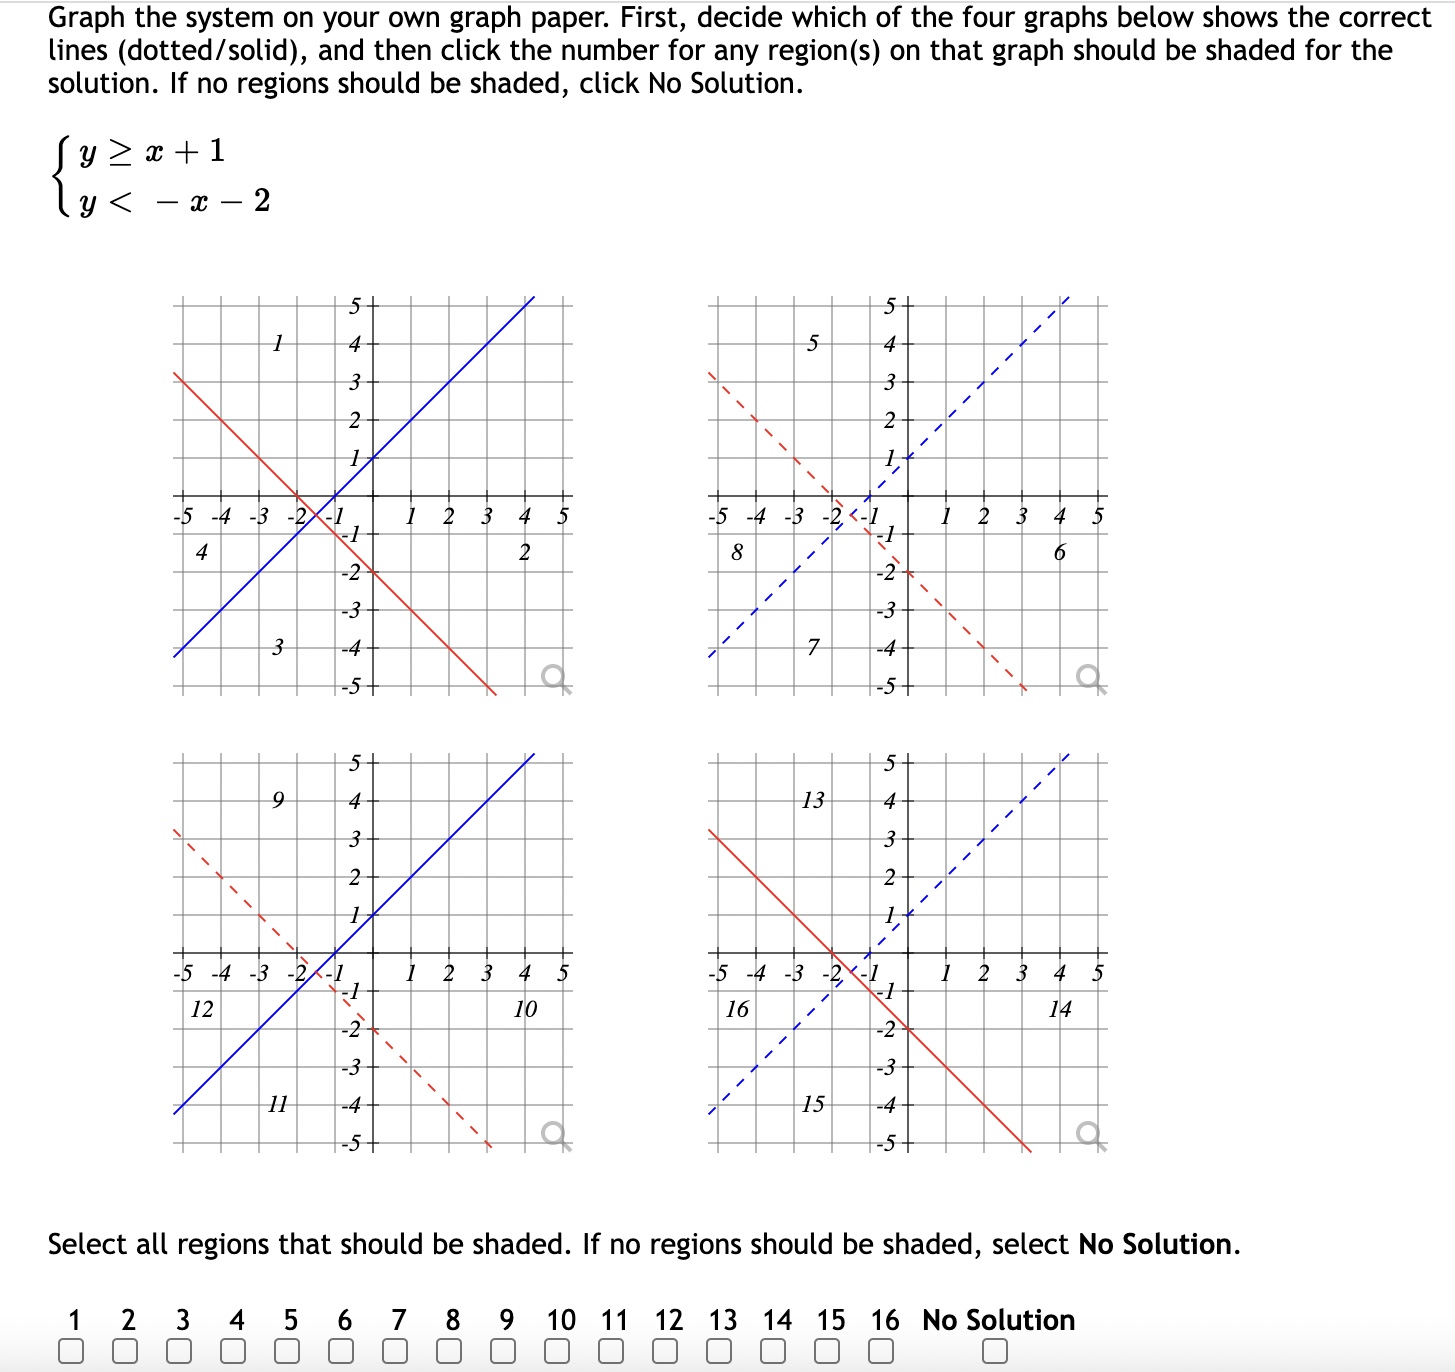
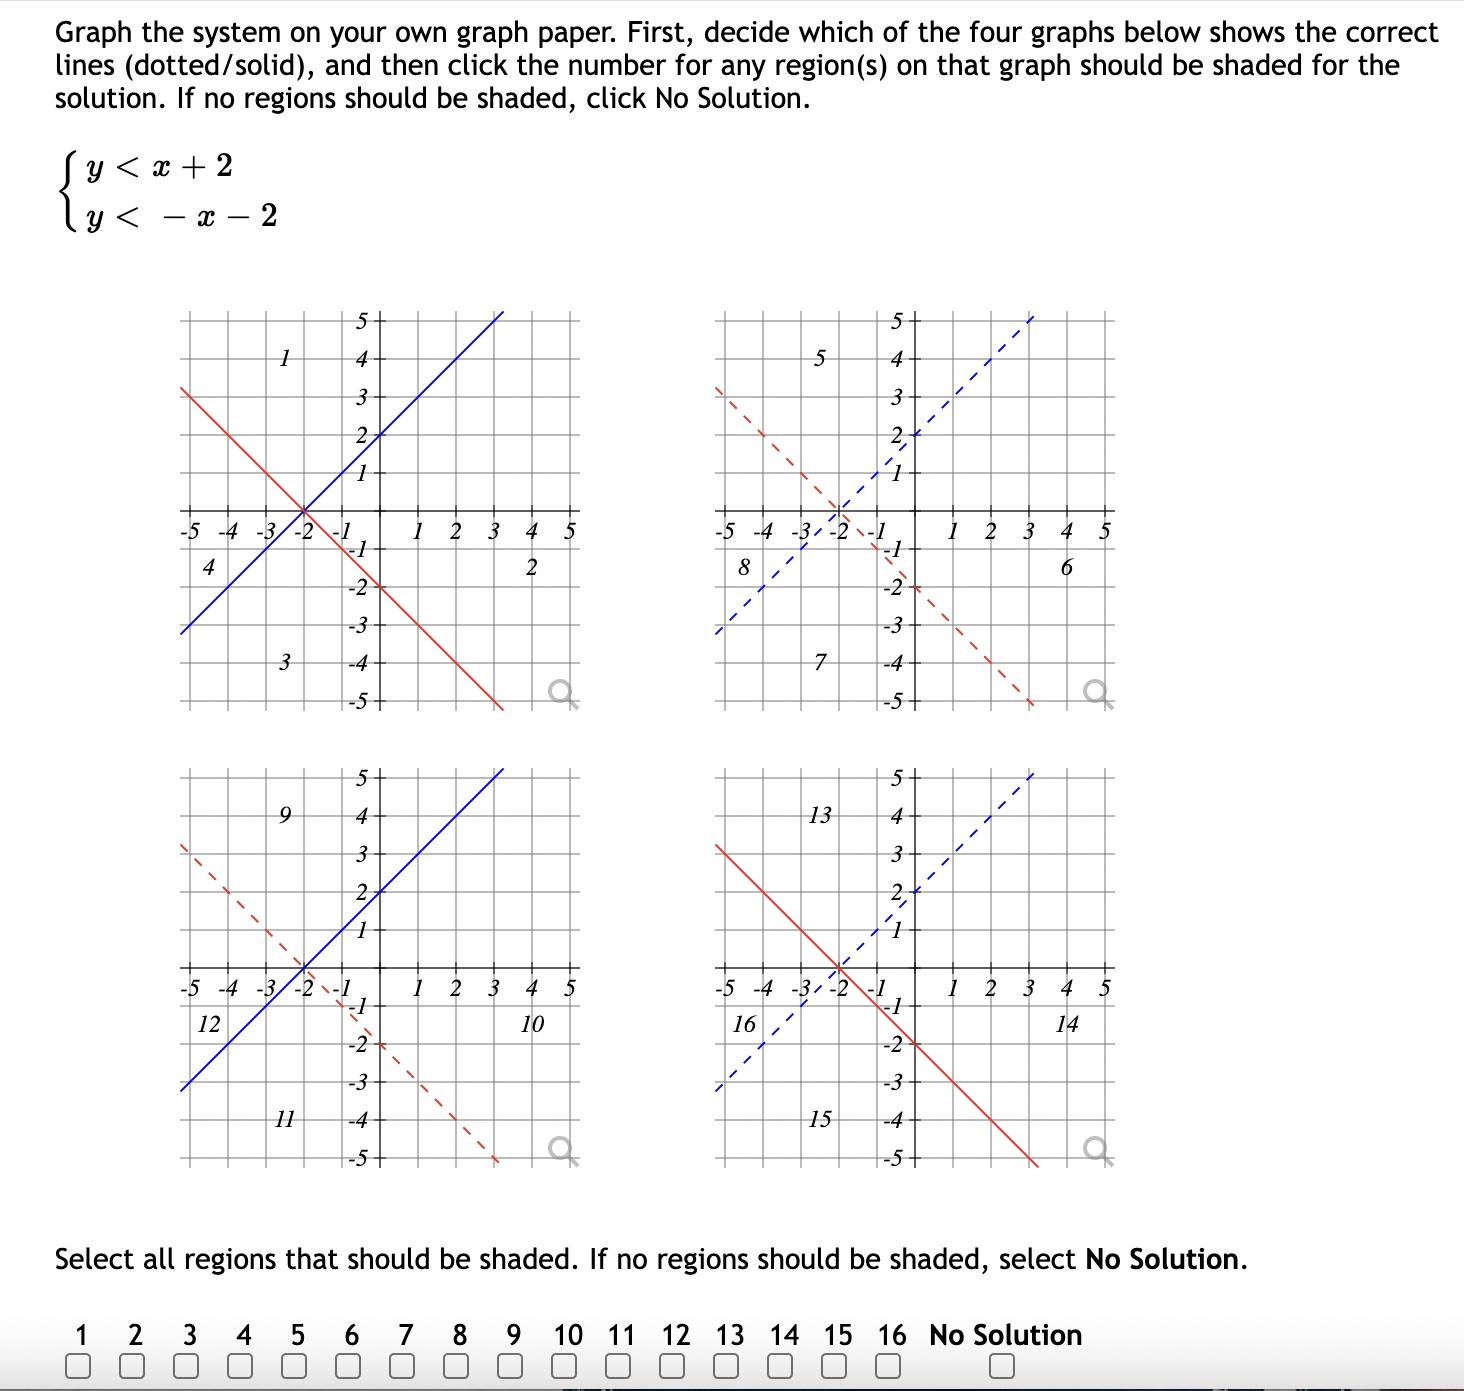
Question: Graph the system on your own graph paper. First, decide which of the four graphs below shows the correct lines (dotted/solid), and then click the


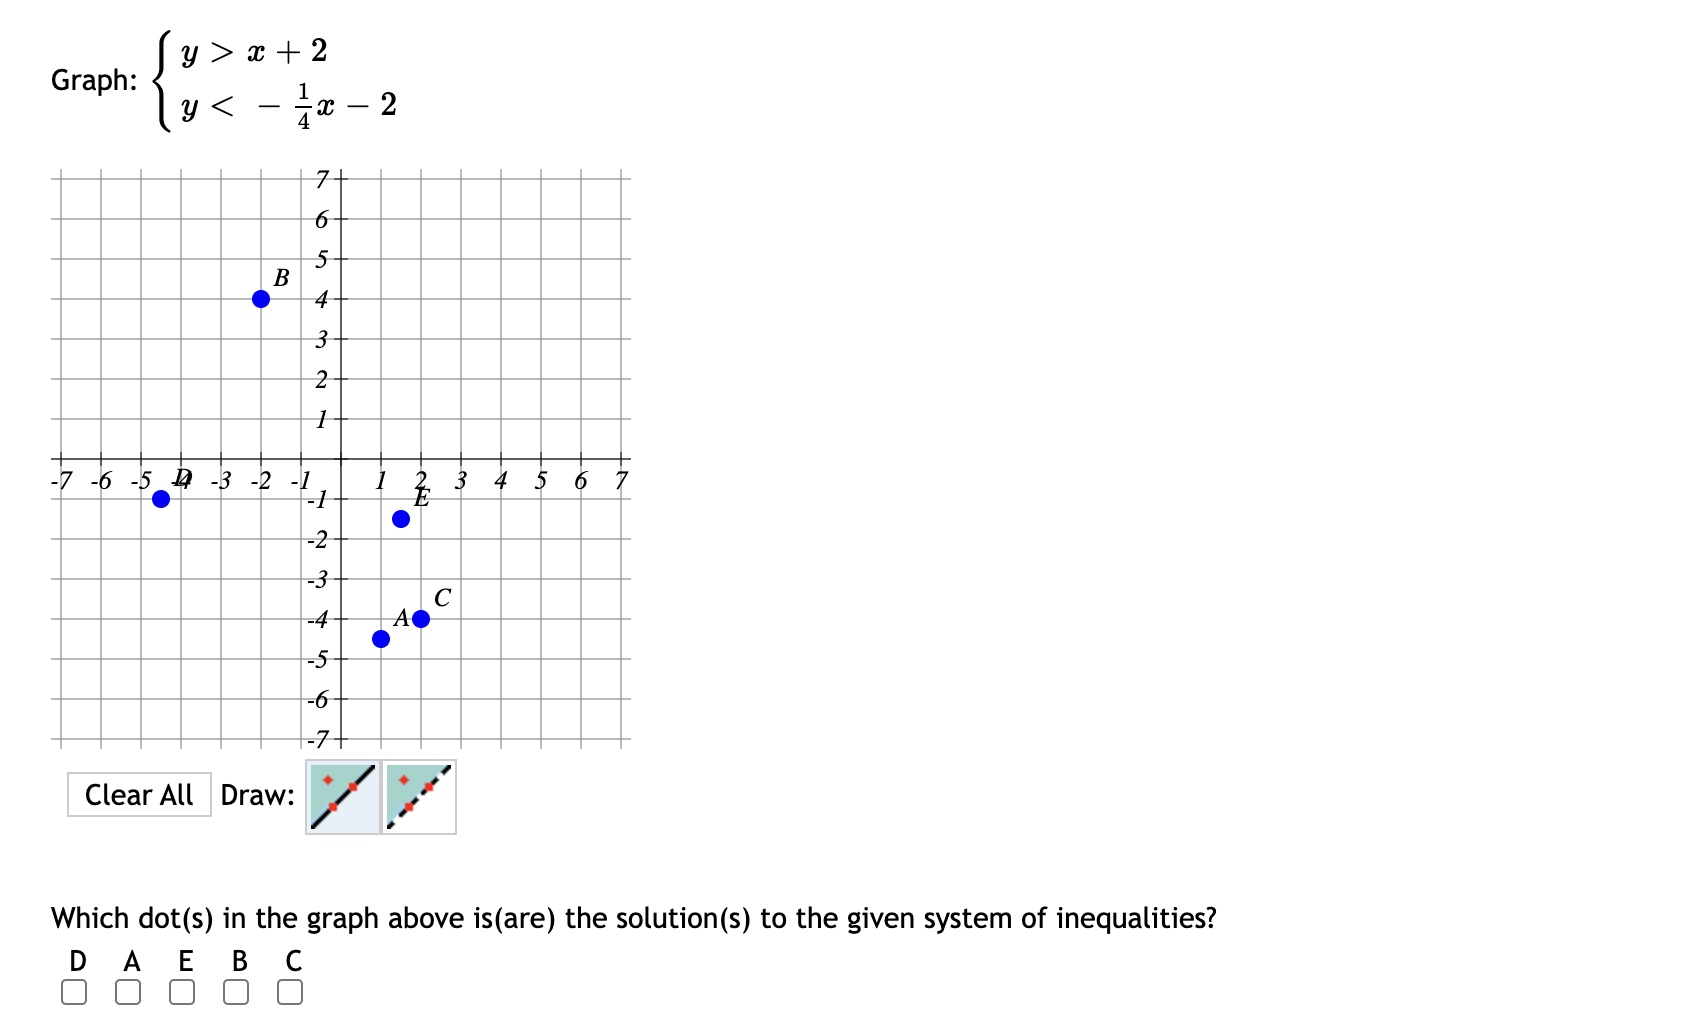


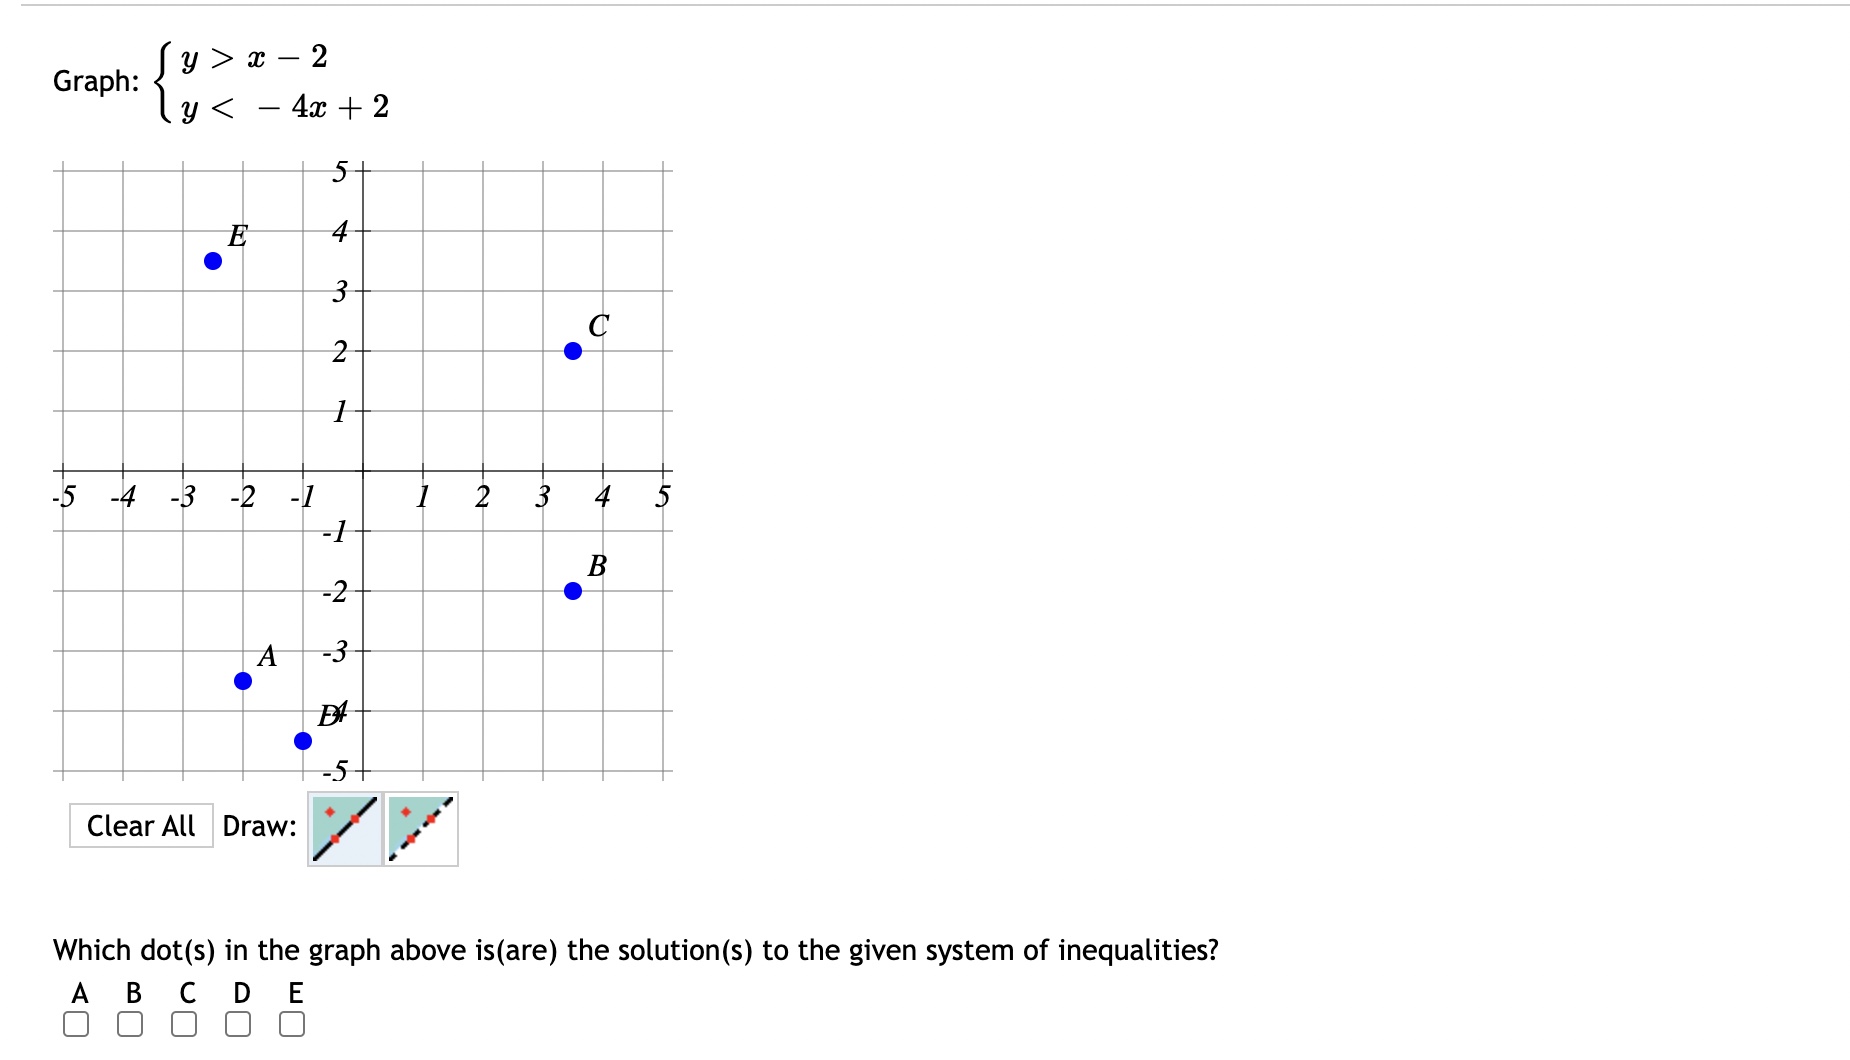
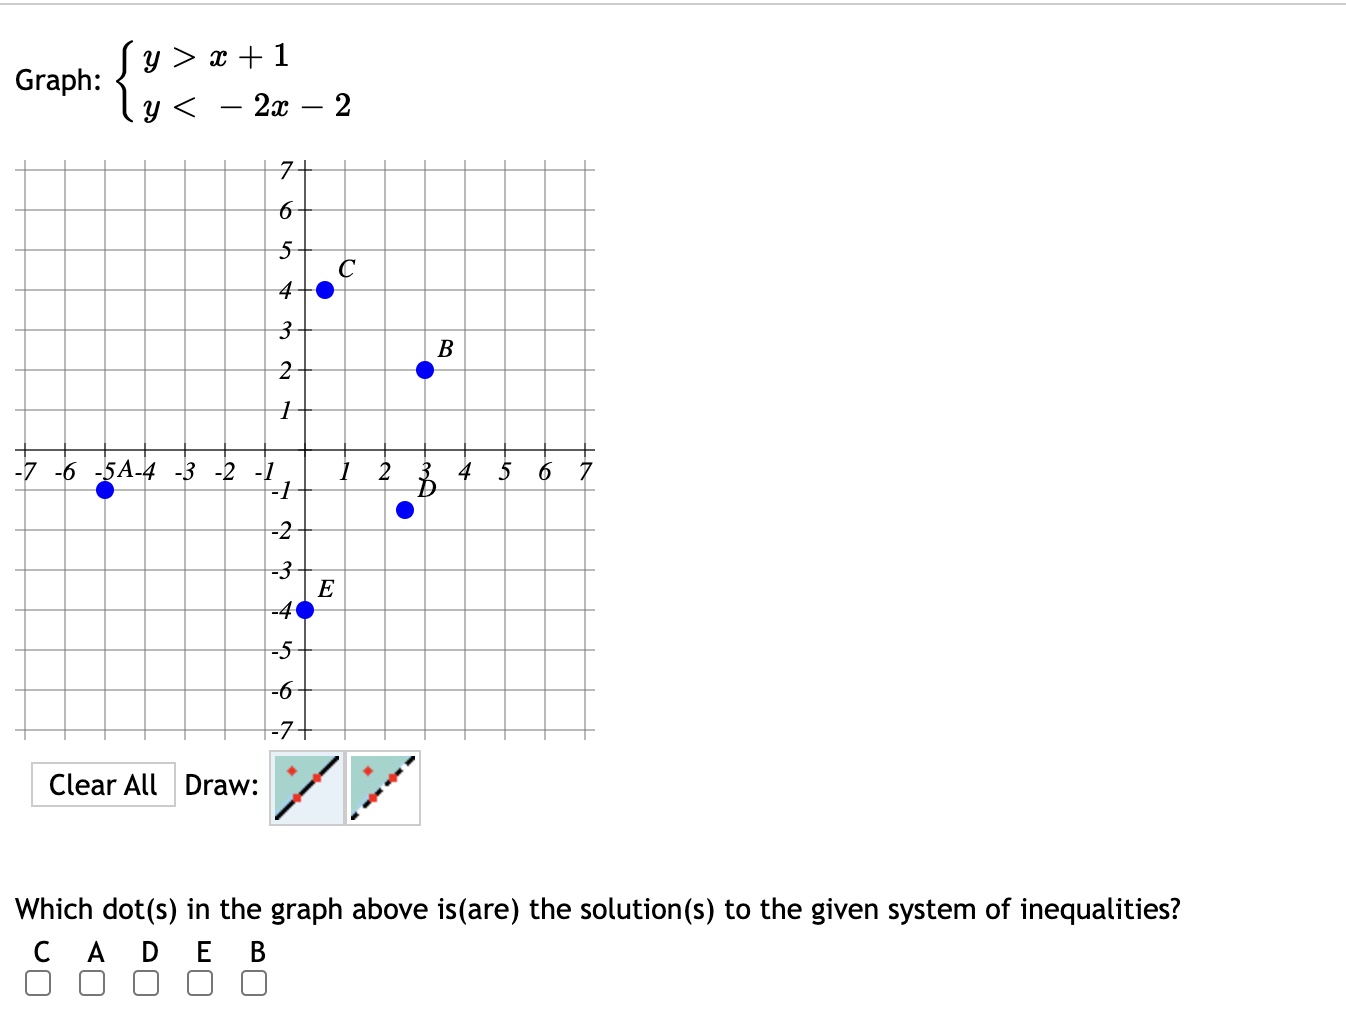


![is(are) the solution(s) to the given system of inequalities? ABCDE DECIDE] Graph:](https://s3.amazonaws.com/si.experts.images/answers/2024/06/6664828e1ffc9_0546664828e02507.jpg)
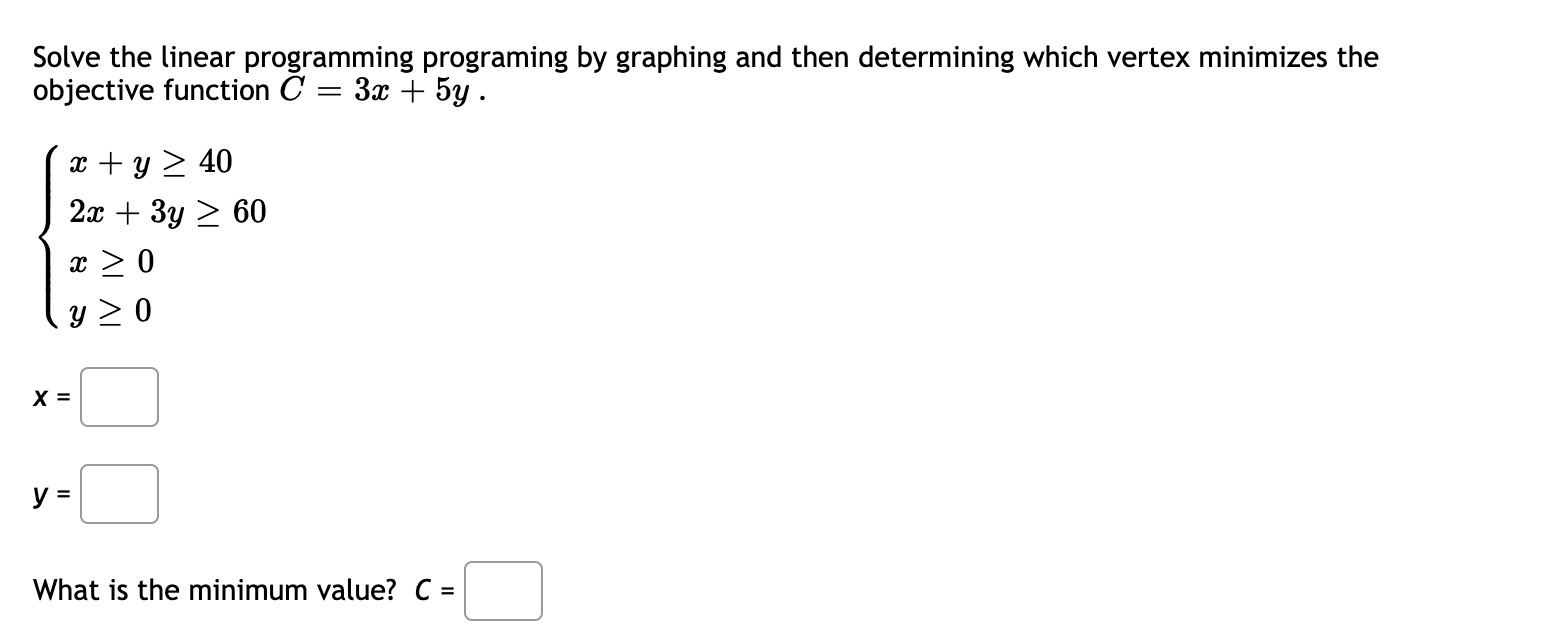


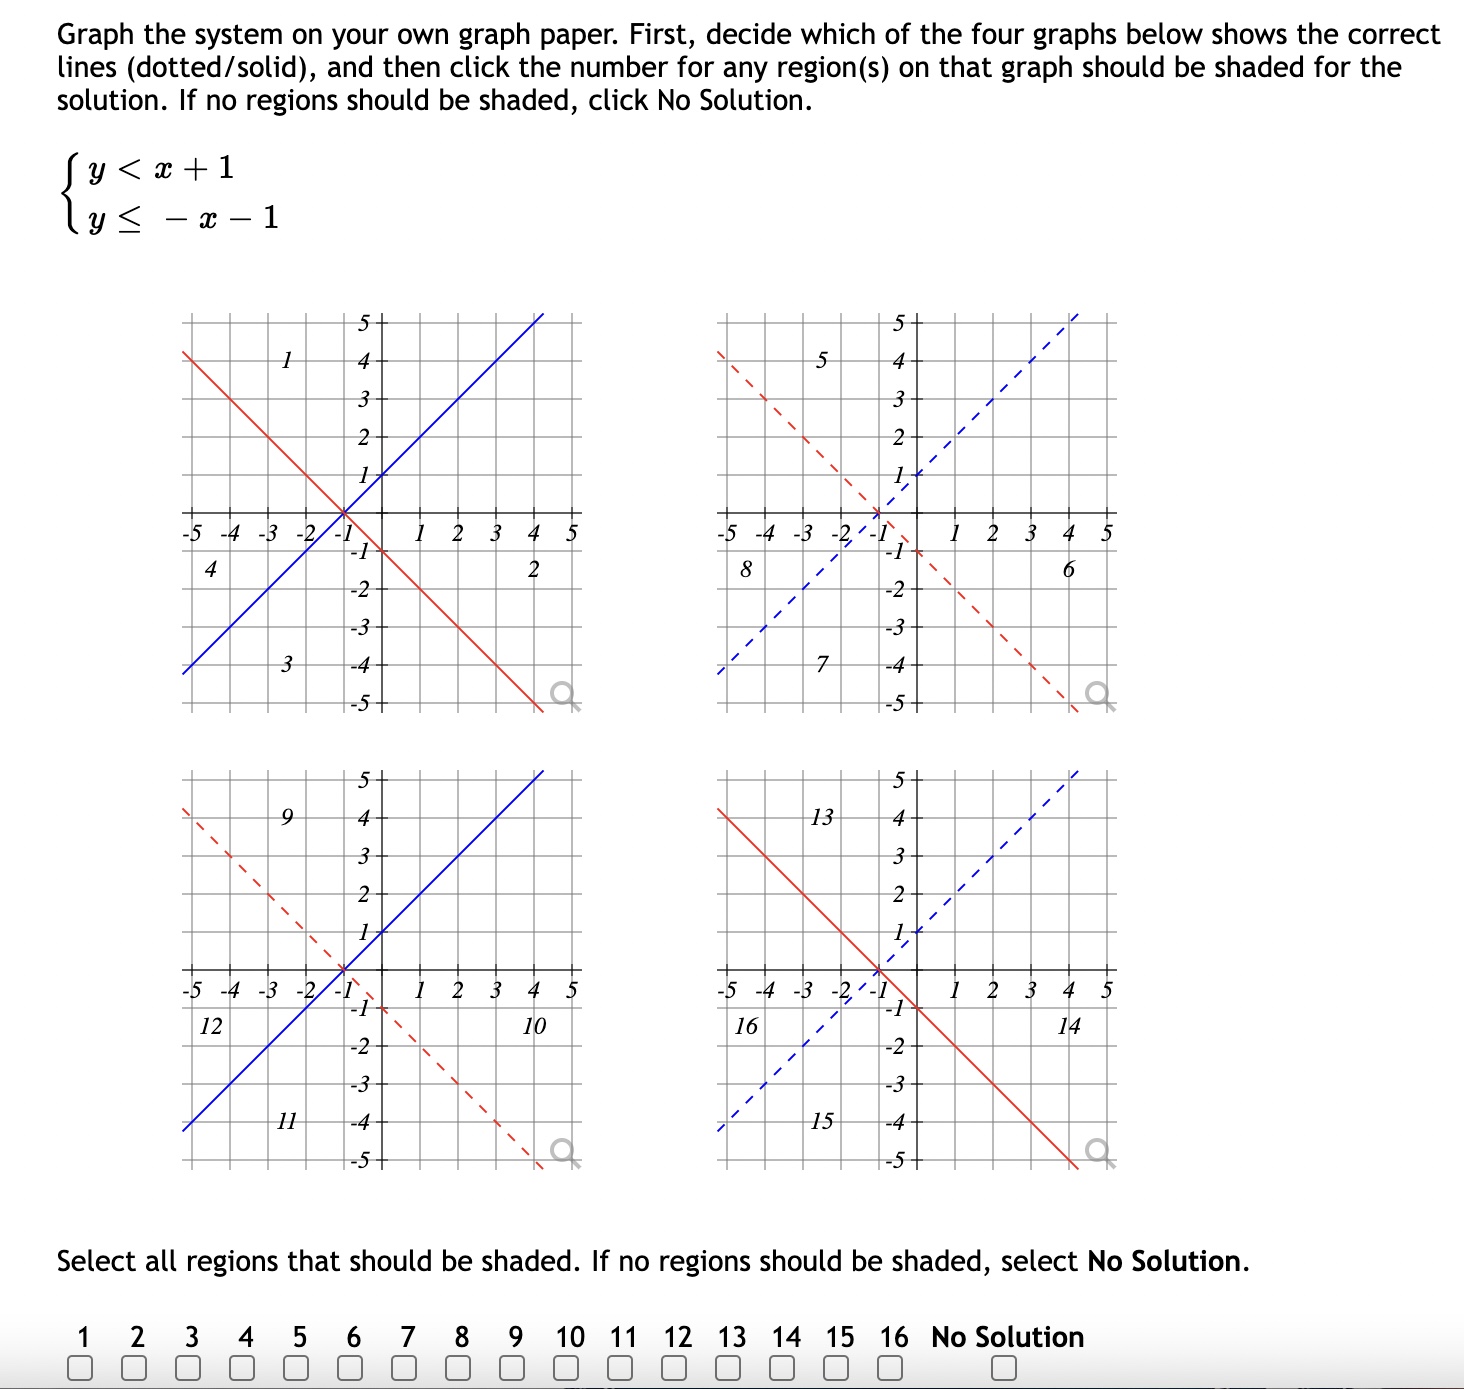
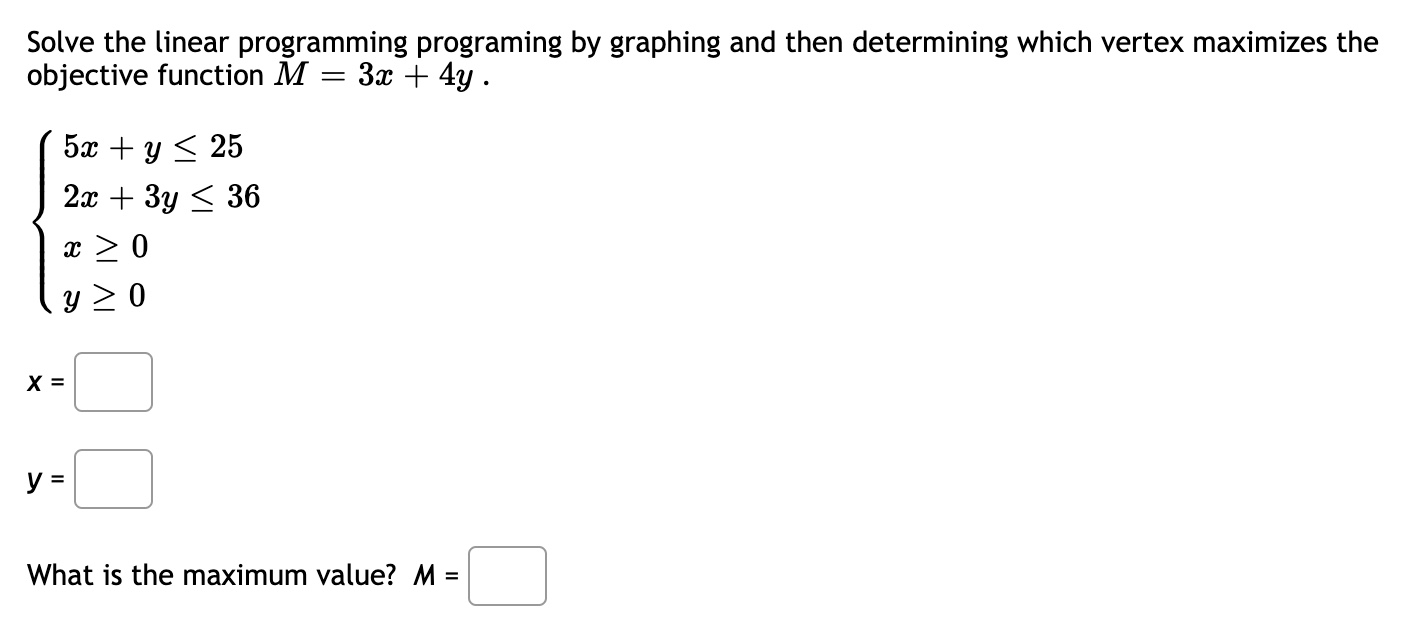
Graph the system on your own graph paper. First, decide which of the four graphs below shows the correct lines (dotted/solid), and then click the number for any region(s) on that graph should be shaded for the solution. If no regions should be shaded, click No Solution. y 0 y 2 0 X = y = What is the minimum value? C =y >x+ 2 Graph: B 7 - 6 -5 1 -3 -2 -1 1 3 4 5 6 C AO Clear All Draw: Which dot(s) in the graph above is(are) the solution(s) to the given system of inequalities? DAEBC 0 0 0 0A farmer is going to divide her 30 acre farm between two crops. Seed for crop A costs $25 per acre. Seed for crop B costs $50 per acre. The farmer can spend at most $1250 on seed. If crop B brings in a profit of $40 per acre, and crop A brings in a profit of $150 per acre, how many acres of each crop should the farmer plant to maximize her profit? acres of crop A Graph the solution to the system of inequalities given below: x 2:c+7 .l I III-IIIIIHIIIIIIIIII Which dot(s) in the graph above is(are) the solution(s) to the given system of inequalities? ABCDE DECIDE] Graph: Jy>x+1 ly
Step by Step Solution
There are 3 Steps involved in it

Get step-by-step solutions from verified subject matter experts