

Question: Graph the time value of each option on a single graph. What does it tell you? Evaluate the change in prices of the Call over
- Graph the time value of each option on a single graph. What does it tell you?
- Evaluate the change in prices of the Call over time relative to the stock (Delta.) What conclusion(s) would you reach?
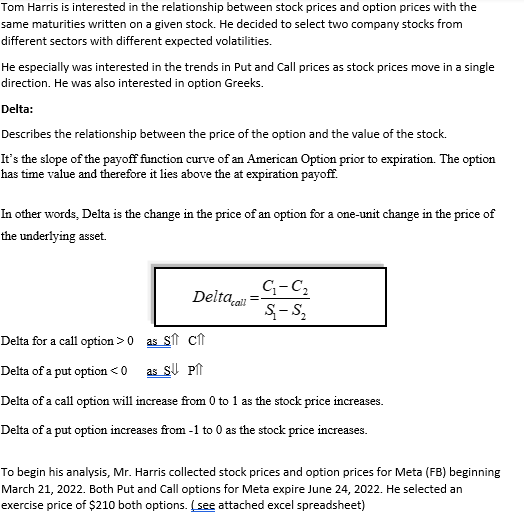
Tom Harris is interested in the relationship between stock prices and option prices with the same maturities written on a given stock. He decided to select two company stocks from different sectors with different expected volatilities. He especially was interested in the trends in Put and Call prices as stock prices move in a single direction. He was also interested in option Greeks. Delta: Describes the relationship between the price of the option and the value of the stock. It's the slope of the payoff function curve of an American Option prior to expiration. The option has time value and therefore it lies above the at expiration payoff. In other words, Delta is the change in the price of an option for a one-unit change in the price of the underlying asset. Delta call C-C S-S Delta for a call option>0 as S C Delta of a put option 0 as S C Delta of a put option
Step by Step Solution
There are 3 Steps involved in it

Get step-by-step solutions from verified subject matter experts