

Question: Graph the trigonometric function. 1 - sin(x 2 Plot all points corresponding to minima and maxima within one cycle. Within that cycle, also plot
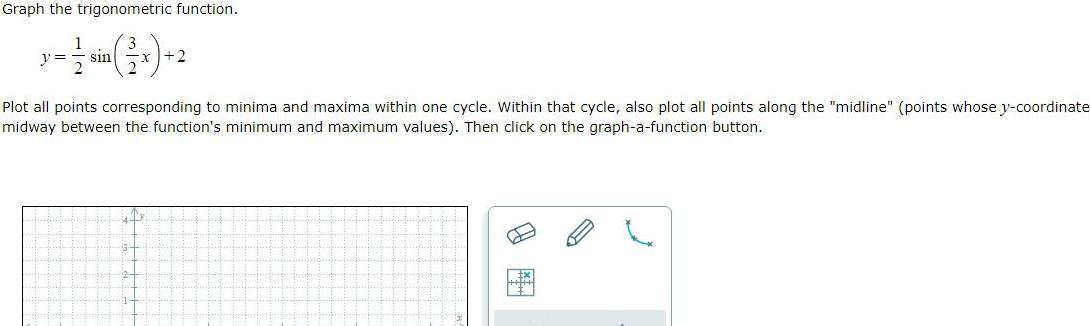
Graph the trigonometric function. 1 - sin(x 2 Plot all points corresponding to minima and maxima within one cycle. Within that cycle, also plot all points along the "midline" (points whose y-coordinate midway between the function's minimum and maximum values). Then click on the graph-a-function button.
Step by Step Solution
There are 3 Steps involved in it
1 Expert Approved Answer
Step: 1 Unlock

Question Has Been Solved by an Expert!
Get step-by-step solutions from verified subject matter experts
Step: 2 Unlock
Step: 3 Unlock