

Question: Graph the trigonometric function 1 y 3 Start by drawing three consecutive asymptotes Then plot two points one on each side of the second asymptote

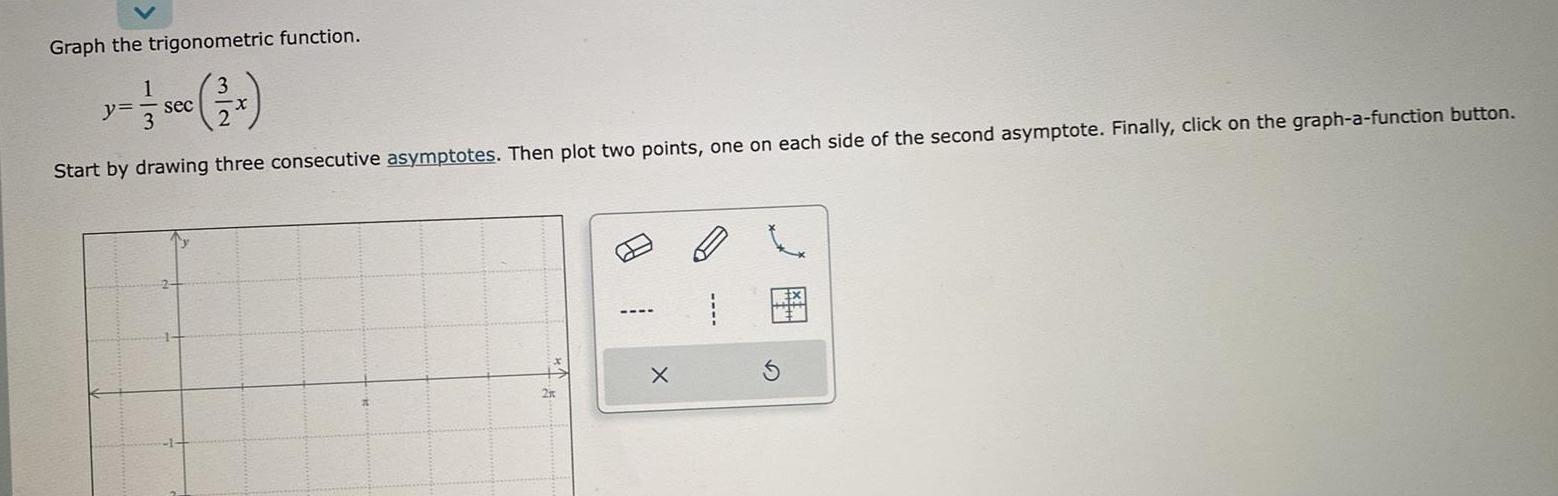
Graph the trigonometric function 1 y 3 Start by drawing three consecutive asymptotes Then plot two points one on each side of the second asymptote Finally click on the graph a function button sec X
Step by Step Solution
There are 3 Steps involved in it
1 Expert Approved Answer
Step: 1 Unlock

Question Has Been Solved by an Expert!
Get step-by-step solutions from verified subject matter experts
Step: 2 Unlock
Step: 3 Unlock