

Question: Graph the trigonometric function. Then give the Xmin and Xmax values for the viewing window [Xmin, Xmax] by [- 10,10] in which the graph is
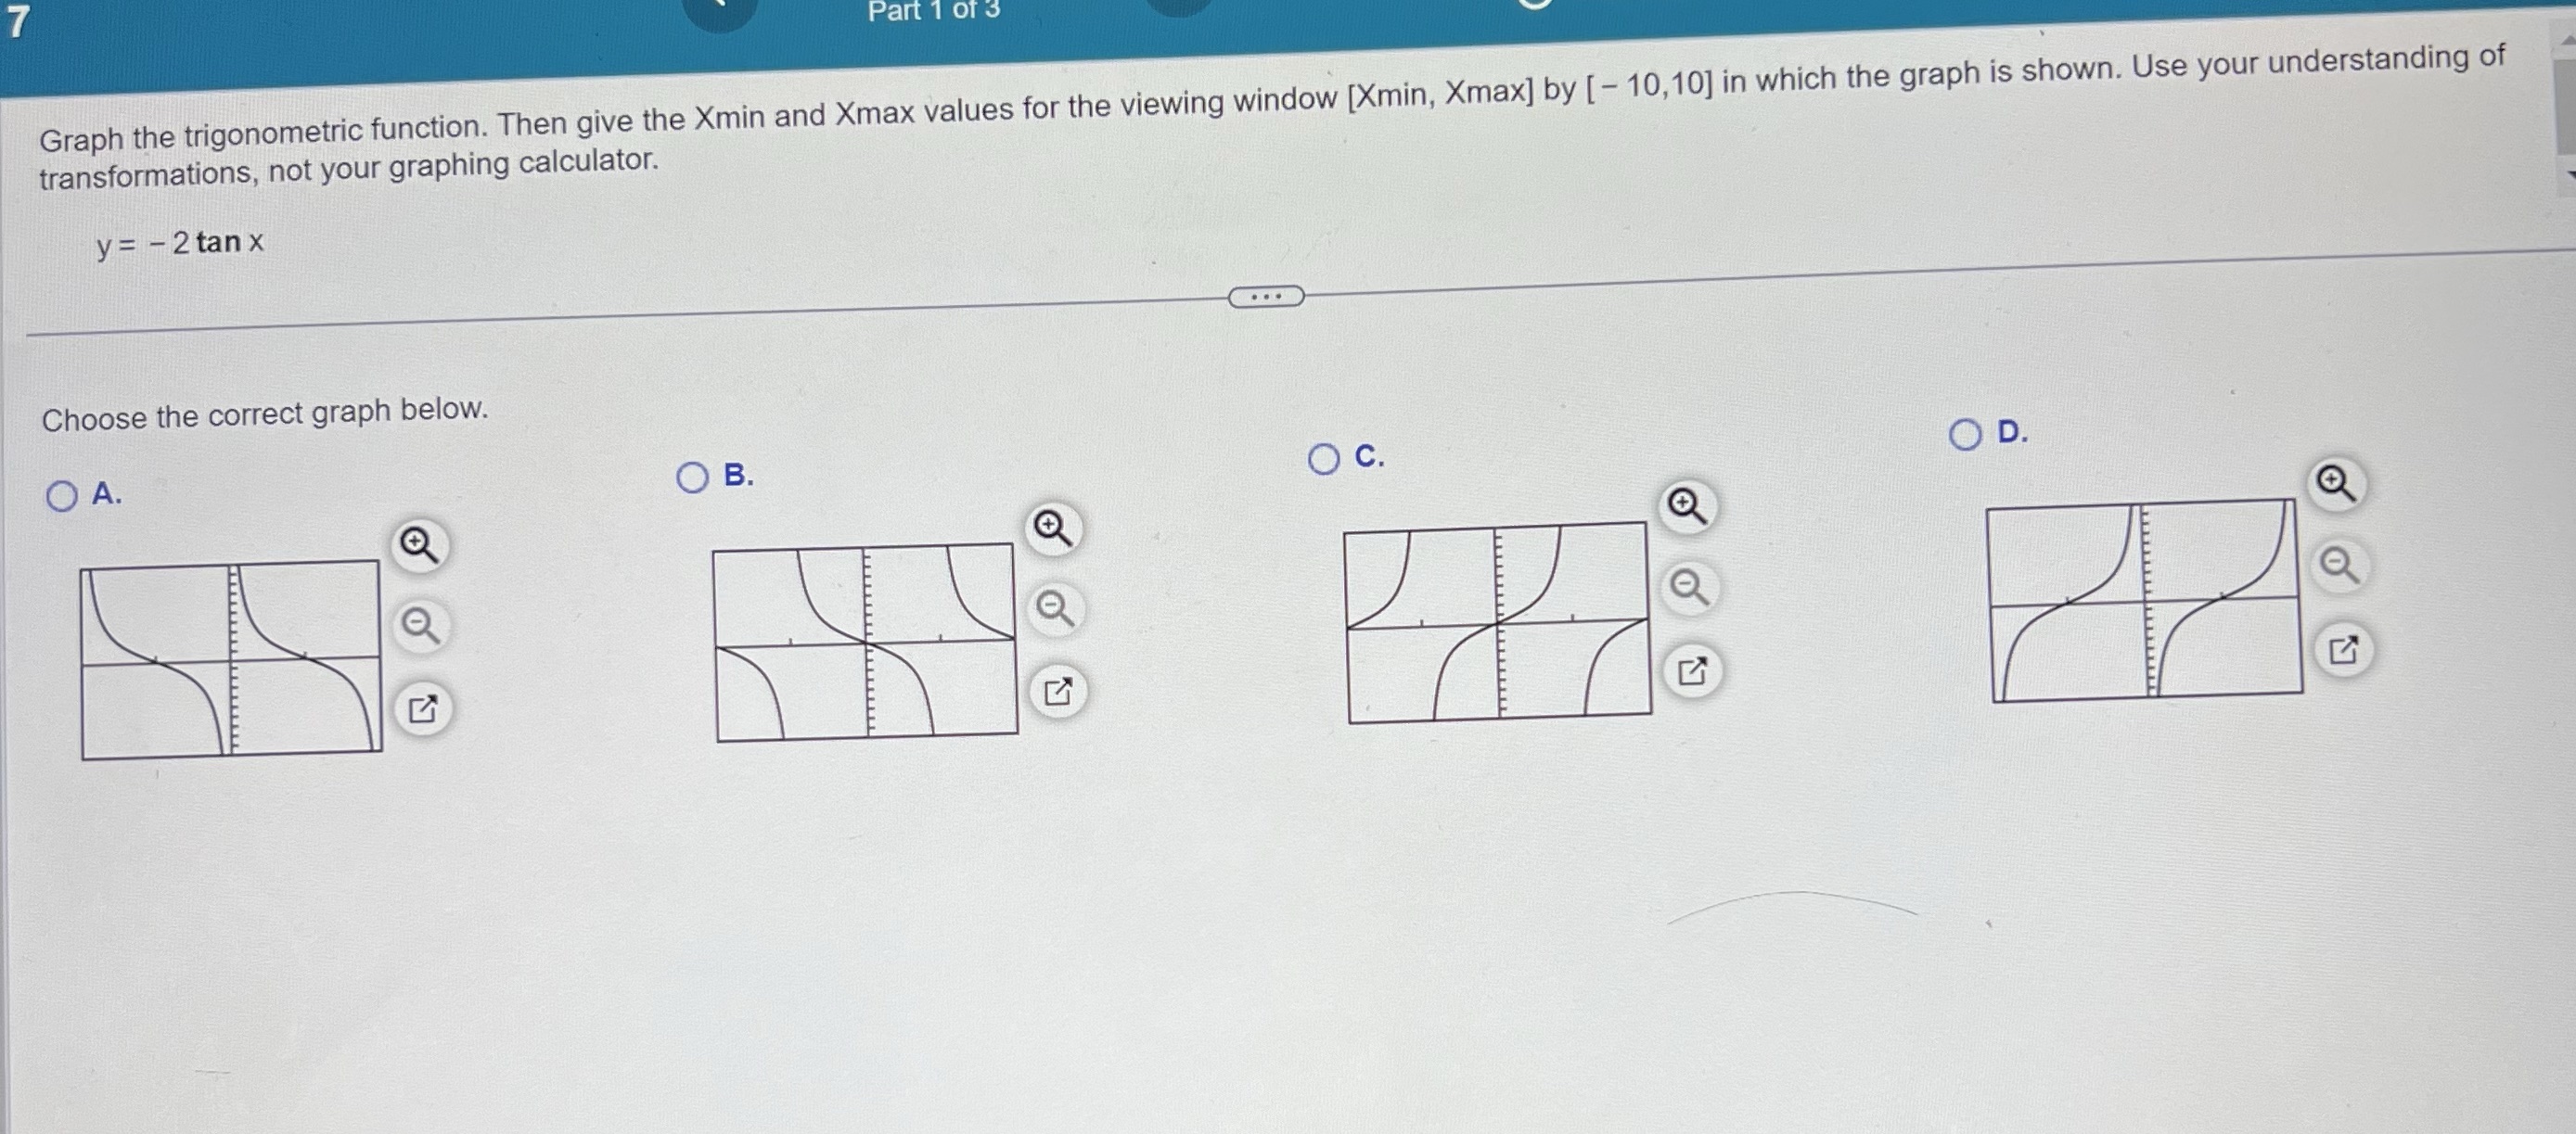
Graph the trigonometric function. Then give the Xmin and Xmax values for the viewing window [Xmin, Xmax] by [- 10,10] in which the graph is shown. Use your understanding of transformations, not your graphing calculator.y= - 2 tan x
![for the viewing window [Xmin, Xmax] by [- 10,10] in which the](https://s3.amazonaws.com/si.experts.images/answers/2024/06/66642ff67cbb6_91066642ff65a46f.jpg)
Part 1 of 3 Graph the trigonometric function. Then give the Xmin and Xmax values for the viewing window [Xmin, Xmax] by [ - 10,10] in which the graph is shown. Use your understanding of transformations, not your graphing calculator. y = - 2 tan x . . . Choose the correct graph below. O A. O B. O c. OD
Step by Step Solution
There are 3 Steps involved in it
1 Expert Approved Answer
Step: 1 Unlock

Question Has Been Solved by an Expert!
Get step-by-step solutions from verified subject matter experts
Step: 2 Unlock
Step: 3 Unlock