

Question: Graph the trigonometric function y cos Plot all points corresponding to x intercepts minima and maxima within one cycle Then click on the graph a
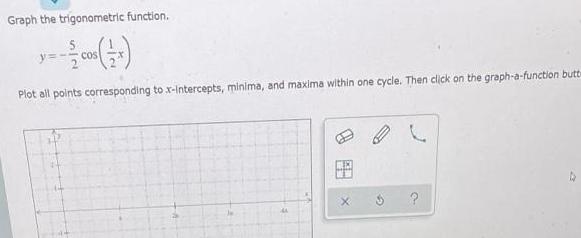

Graph the trigonometric function y cos Plot all points corresponding to x intercepts minima and maxima within one cycle Then click on the graph a function butte
Step by Step Solution
There are 3 Steps involved in it
1 Expert Approved Answer
Step: 1 Unlock

Question Has Been Solved by an Expert!
Get step-by-step solutions from verified subject matter experts
Step: 2 Unlock
Step: 3 Unlock