

Question: Graph The.PY - diagrambelow shows an isobaric process. Determine how much work was done as the system went from the red dot to the blue
Graph
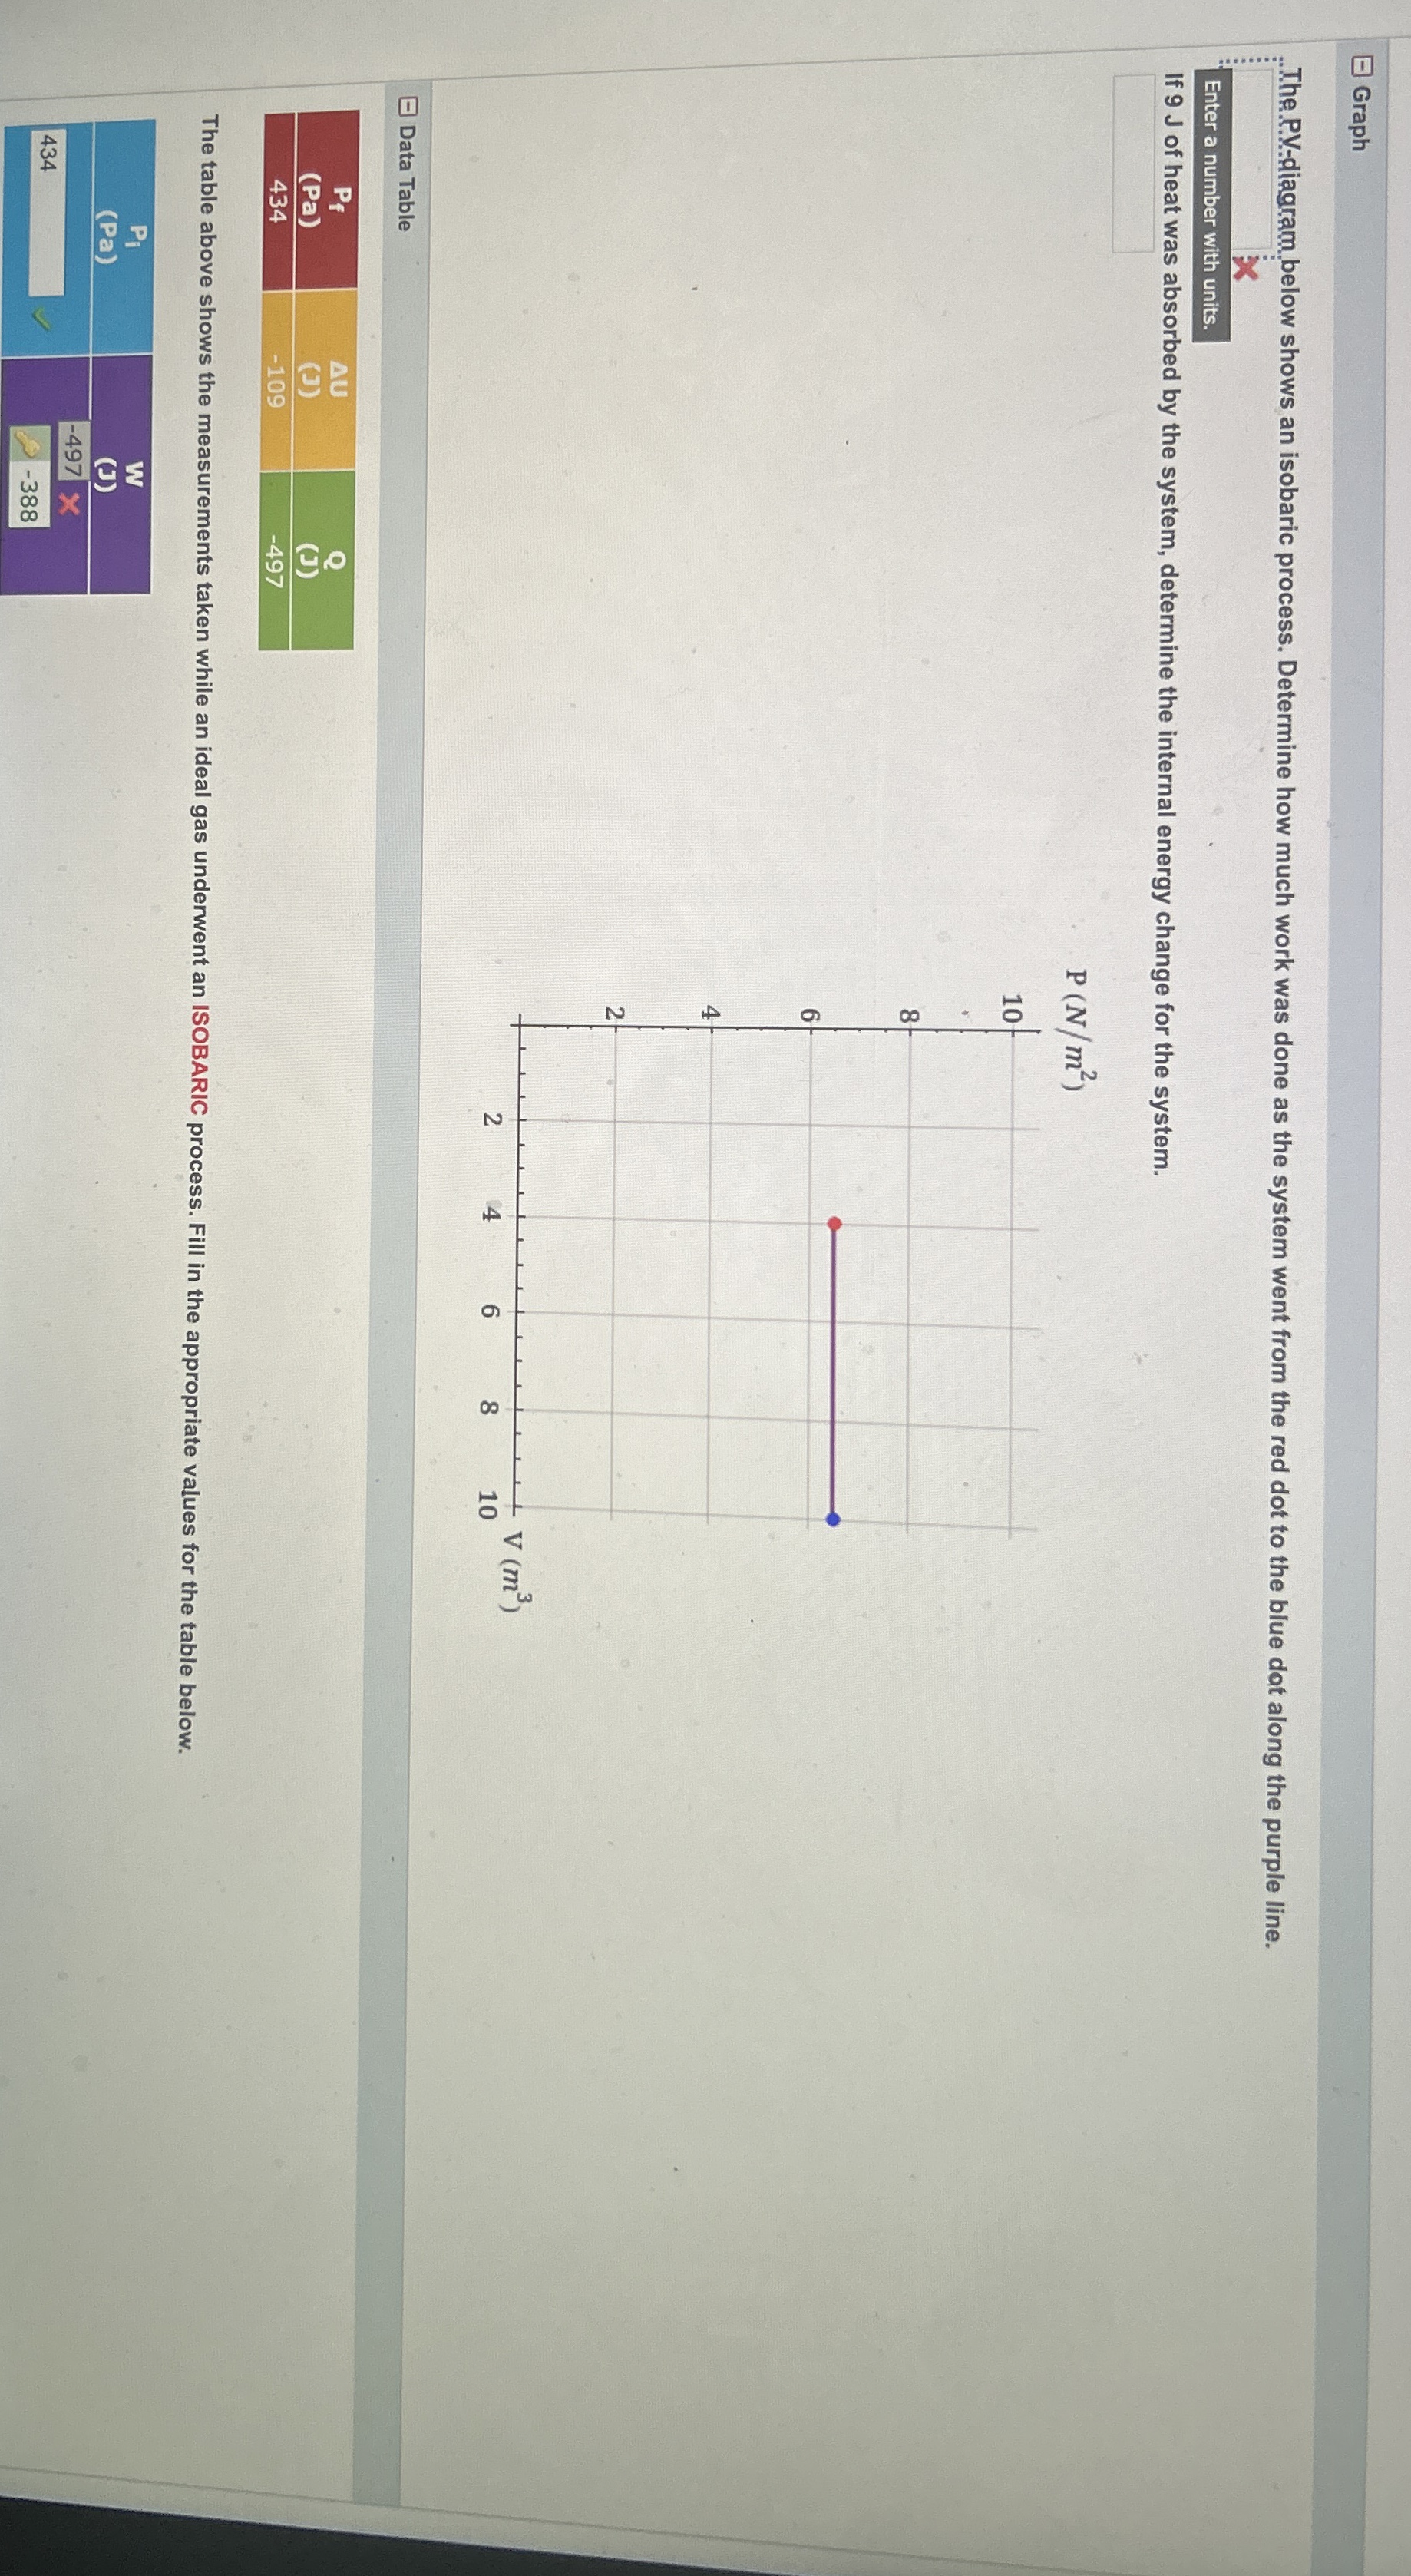
The.PYdiagrambelow shows an isobaric process. Determine how much work was done as the system went from the red dot to the blue dat along the purple line.
Enter a number with units.
If J of heat was absorbed by the system, determine the internal energy change for the system.
Data Table
tabletable
Step by Step Solution
There are 3 Steps involved in it
1 Expert Approved Answer
Step: 1 Unlock

Question Has Been Solved by an Expert!
Get step-by-step solutions from verified subject matter experts
Step: 2 Unlock
Step: 3 Unlock