

Question: Graph these cost behaviour patterns over a relevant range of 010,000 units: a. Variable expenses of $9 per unit b. Mixed expenses made up of
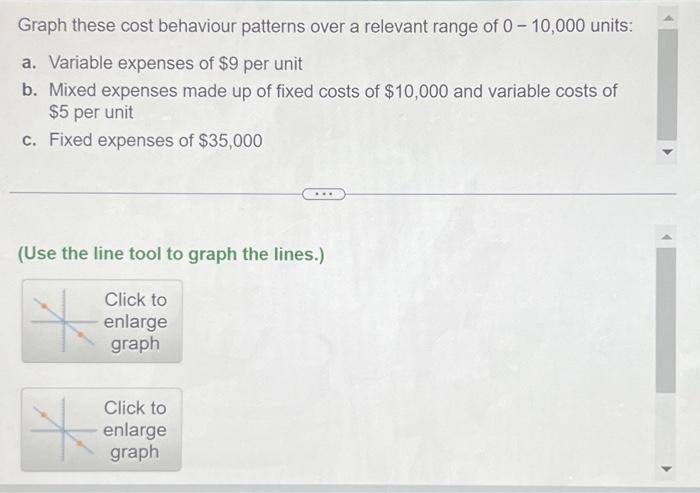
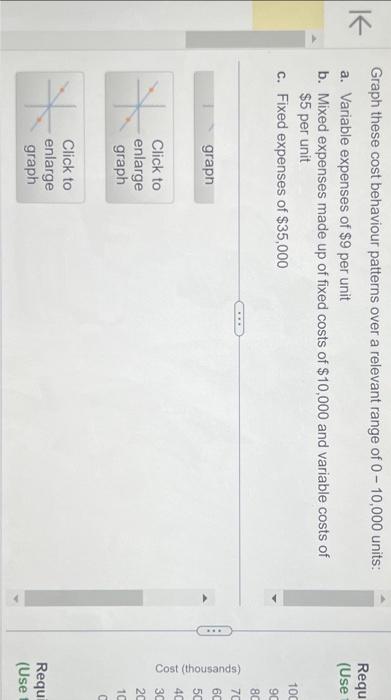

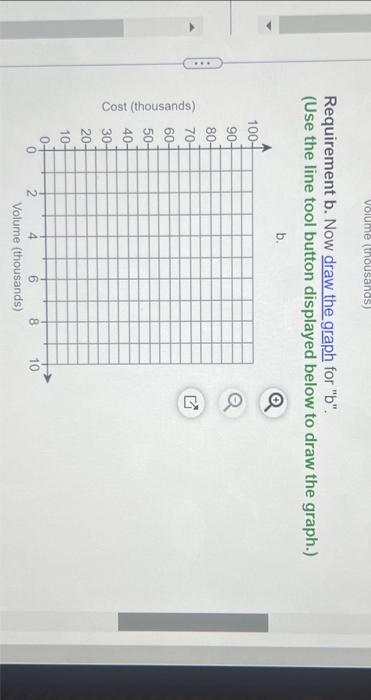
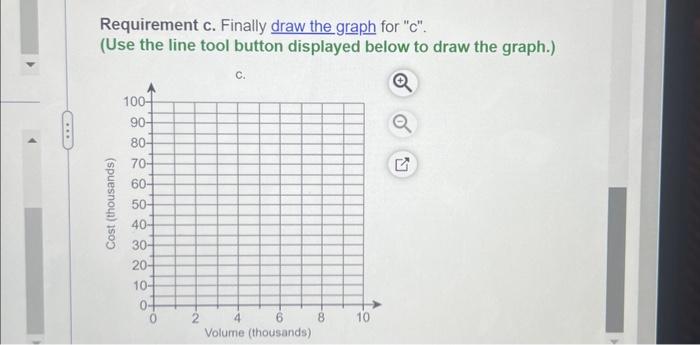
Graph these cost behaviour patterns over a relevant range of 010,000 units: a. Variable expenses of $9 per unit b. Mixed expenses made up of fixed costs of $10,000 and variable costs of $5 per unit c. Fixed expenses of $35,000 (Use the line tool to graph the lines.) Graph these cost behaviour patterns over a relevant range of 010,000 units: a. Variable expenses of $9 per unit b. Mixed expenses made up of fixed costs of $10,000 and variable costs of $5 per unit c. Fixed expenses of $35,000 Requirement a. First let's draw the graph for "a". (Use the line tool button displayed below to draw the graph.) Requirement b. Now draw the graph for " b ". (Use the line tool button displayed below to draw the graph.) Requirement b. Now draw the graph for " b ". (Use the line tool button displayed below to draw the graph.) Requirement c. Finally draw the graph for " c ". (Use the line tool button displayed below to draw the graph.)
Step by Step Solution
There are 3 Steps involved in it

Get step-by-step solutions from verified subject matter experts