

Question: graph this data Input Power (W) versus Discharge capacity (GPM). Use separate curves for each RPM. Pump head (ft) versus Discharge capacity (GPM). Use separate
graph this data
- Input Power (W) versus Discharge capacity (GPM). Use separate curves for each RPM.
- Pump head (ft) versus Discharge capacity (GPM). Use separate curves for each RPM.
- Pump overall efficiency (η) versus Discharge capacity (GPM). Use separate curves for each RPM.
- Head coefficient (Ch) versus Flow coefficient (Cq). Use data for all RPM's on one curve.
- Power coefficient (Cp) versus Flow coefficient (Cq). Use data for all RPM's on one curve.
- Pump overall efficiency (η) versus Flow coefficient (Cq). Use data for all RPM's on one curve.
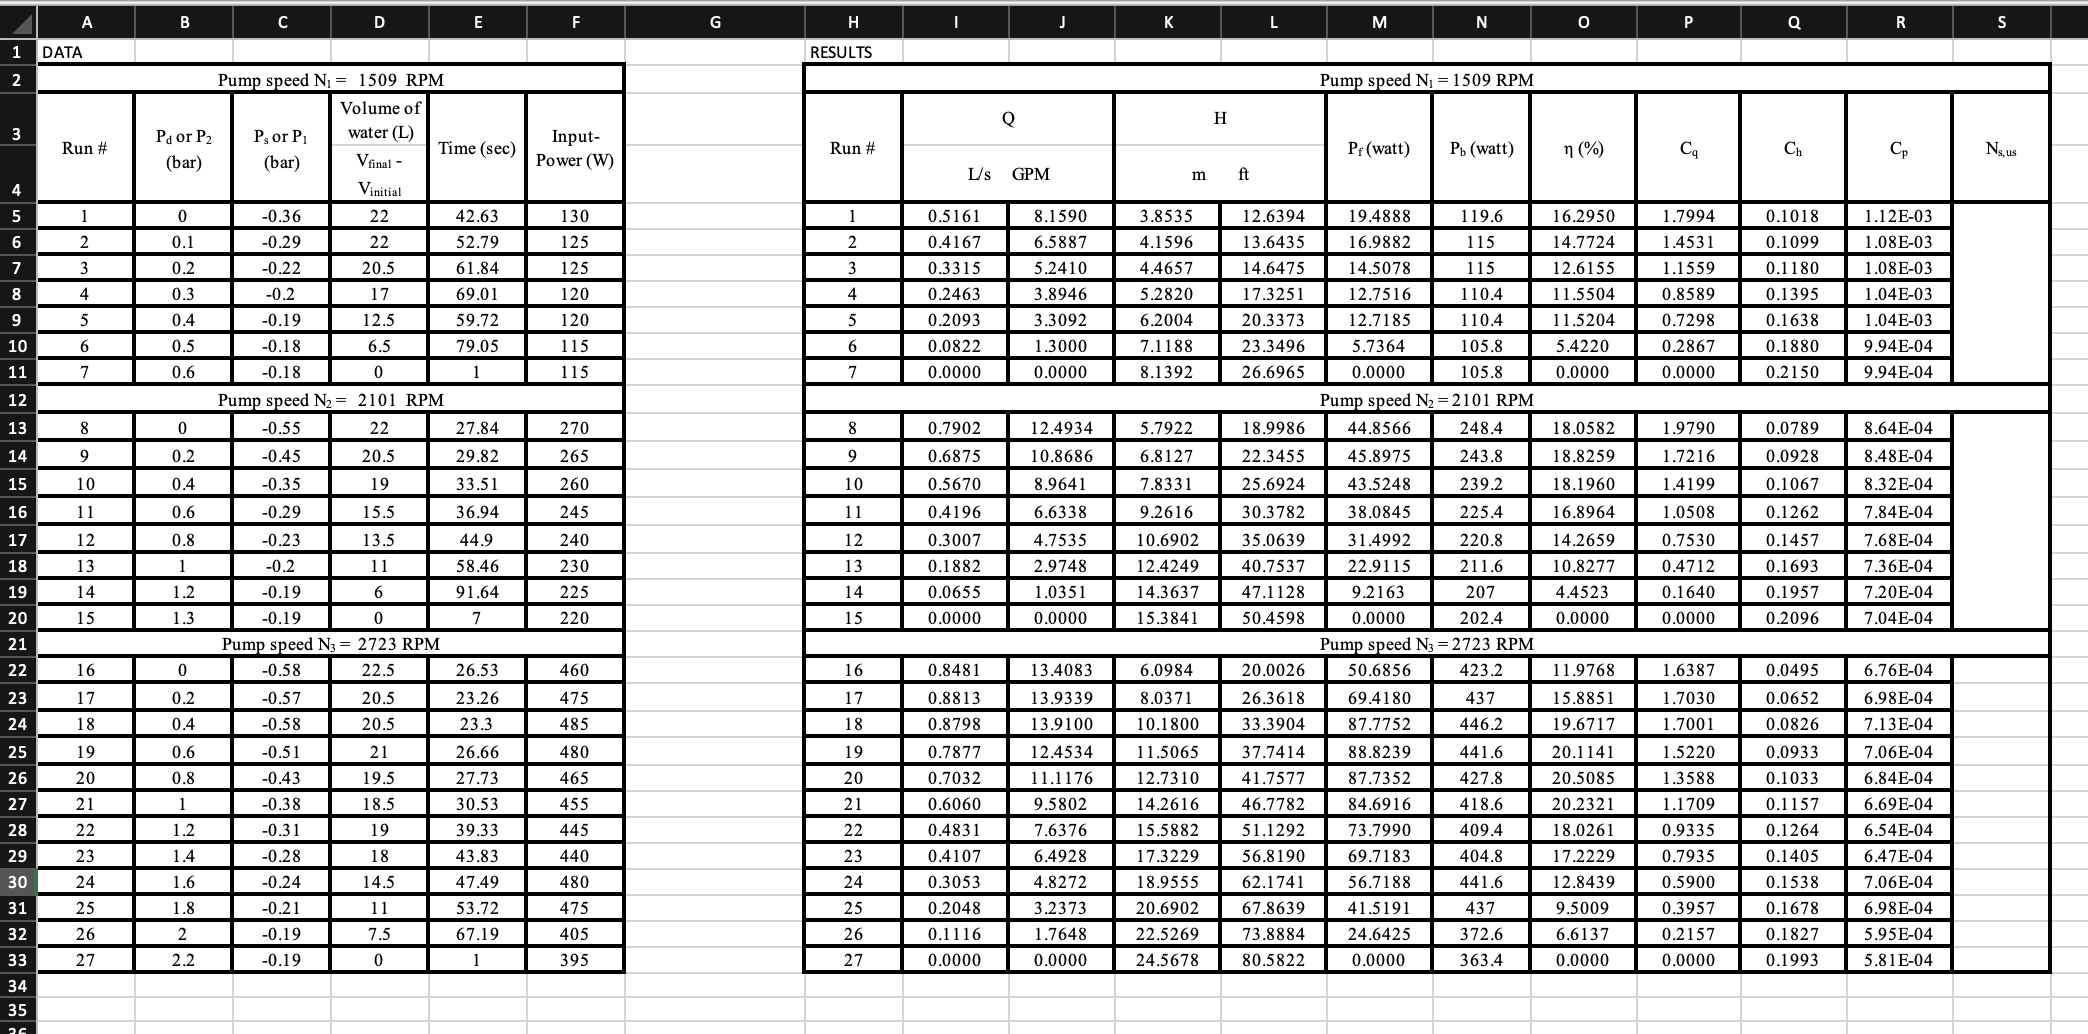
A B C D E F G 1 DATA 2 Pump speed N = 1509 RPM H I J K L M N P Q R S RESULTS Volume of Q Pump speed N = 1509 RPM H 3 Pa or P2 Ps or P water (L) Run # Time (sec) 4 1567822211022222222222220323731 1 0 2 0.1 3 0.2 4 9 5 6 7 8 14 9 10 11 12 13 19 14 15 16 17 24 18 19 20 21 22 29 23 24 25 26 27 9 -3333337-3383-277-8333-333-3 (bar) (bar) Vfinal - Input- Power (W) Run # Pf (watt) Pb (watt) n(%) Cq Ch Cp Ns, us L/s GPM m ft Vinitial -0.36 22 42.63 130 1 0.5161 8.1590 3.8535 12.6394 19.4888 -0.29 22 52.79 125 2 0.4167 6.5887 4.1596 13.6435 16.9882 -0.22 20.5 61.84 125 3 0.3315 5.2410 4.4657 14.6475 14.5078 119.6 115 115 16.2950 14.7724 1.7994 0.1018 1.12E-03 1.4531 0.1099 1.08E-03 12.6155 1.1559 0.1180 1.08E-03 0.3 -0.2 17 69.01 120 4 0.2463 3.8946 5.2820 17.3251 12.7516 110.4 11.5504 0.8589 0.1395 1.04E-03 0.4 -0.19 12.5 59.72 120 5 0.2093 3.3092 6.2004 20.3373 12.7185 110.4 11.5204 0.7298 0.1638 1.04E-03 0.5 -0.18 6.5 79.05 115 6 0.0822 1.3000 7.1188 23.3496 5.7364 105.8 5.4220 0.2867 0.1880 9.94E-04 0.6 -0.18 0 1 115 7 0.0000 0.0000 8.1392 26.6965 0.0000 105.8 0.0000 0.0000 0.2150 9.94E-04 Pump speed N = 2101 RPM Pump speed N = 2101 RPM 0 -0.55 22 27.84 270 8 0.7902 12.4934 5.7922 0.2 -0.45 20.5 29.82 265 9 0.6875 10.8686 6.8127 18.9986 22.3455 44.8566 248.4 18.0582 1.9790 0.0789 8.64E-04 45.8975 243.8 18.8259 1.7216 0.0928 8.48E-04 0.4 -0.35 19 33.51 260 10 0.5670 8.9641 7.8331 25.6924 43.5248 239.2 18.1960 1.4199 0.1067 8.32E-04 0.6 -0.29 15.5 36.94 245 11 0.4196 6.6338 9.2616 30.3782 38.0845 225.4 16.8964 1.0508 0.1262 7.84E-04 0.8 -0.23 13.5 44.9 240 12 0.3007 4.7535 10.6902 35.0639 31.4992 220.8 14.2659 0.7530 0.1457 7.68E-04 1 -0.2 11 58.46 230 13 0.1882 2.9748 12.4249 40.7537 22.9115 211.6 10.8277 0.4712 0.1693 7.36E-04 1.2 -0.19 6 91.64 225 14 0.0655 1.0351 14.3637 47.1128 9.2163 1.3 -0.19 0 7 220 15 0.0000 0.0000 15.3841 50.4598 0.0000 207 202.4 4.4523 0.1640 0.1957 7.20E-04 0.0000 0.0000 0.2096 7.04E-04 Pump speed N3 = 2723 RPM 0 -0.58 22.5 26.53 460 16 0.8481 13.4083 6.0984 0.2 -0.57 20.5 23.26 475 17 0.8813 13.9339 8.0371 20.0026 26.3618 Pump speed N3 = 2723 RPM 50.6856 69.4180 0.4 -0.58 20.5 23.3 485 18 0.8798 13.9100 10.1800 33.3904 87.7752 0.6 -0.51 21 26.66 480 19 0.7877 12.4534 11.5065 37.7414 88.8239 423.2 437 446.2 441.6 11.9768 1.6387 0.0495 6.76E-04 15.8851 1.7030 0.0652 6.98E-04 19.6717 1.7001 0.0826 7.13E-04 20.1141 1.5220 0.0933 7.06E-04 0.8 -0.43 19.5 27.73 465 20 0.7032 11.1176 12.7310 41.7577 87.7352 427.8 20.5085 1.3588 0.1033 6.84E-04 1 -0.38 18.5 30.53 455 21 0.6060 9.5802 14.2616 46.7782 84.6916 418.6 20.2321 1.1709 0.1157 6.69E-04 1.2 -0.31 19 39.33 445 22 0.4831 7.6376 15.5882 51.1292 73.7990 409.4 18.0261 0.9335 0.1264 6.54E-04 1.4 -0.28 18 43.83 440 23 0.4107 6.4928 17.3229 56.8190 69.7183 404.8 17.2229 0.7935 0.1405 6.47E-04 1.6 -0.24 14.5 47.49 480 24 0.3053 4.8272 18.9555 62.1741 1.8 -0.21 11 53.72 475 25 0.2048 3.2373 20.6902 67.8639 -0.19 7.5 67.19 405 26 0.1116 1.7648 22.5269 73.8884 2.2 -0.19 0 395 27 0.0000 0.0000 24.5678 80.5822 56.7188 41.5191 24.6425 0.0000 441.6 12.8439 0.5900 0.1538 7.06E-04 437 9.5009 0.3957 0.1678 6.98E-04 372.6 6.6137 0.2157 0.1827 5.95E-04 363.4 0.0000 0.0000 0.1993 5.81E-04 34
Step by Step Solution
There are 3 Steps involved in it
Solutions Step 1 To graph the data of Input Power WW versus Discharge LsLs we can follo... View full answer

Get step-by-step solutions from verified subject matter experts