

Question: Graph using desmos please and also please tell me how u graphed it using desmos I literally have no idea how to lol Data Table
Graph using desmos please and also please tell me how u graphed it using desmos I literally have no idea how to lol
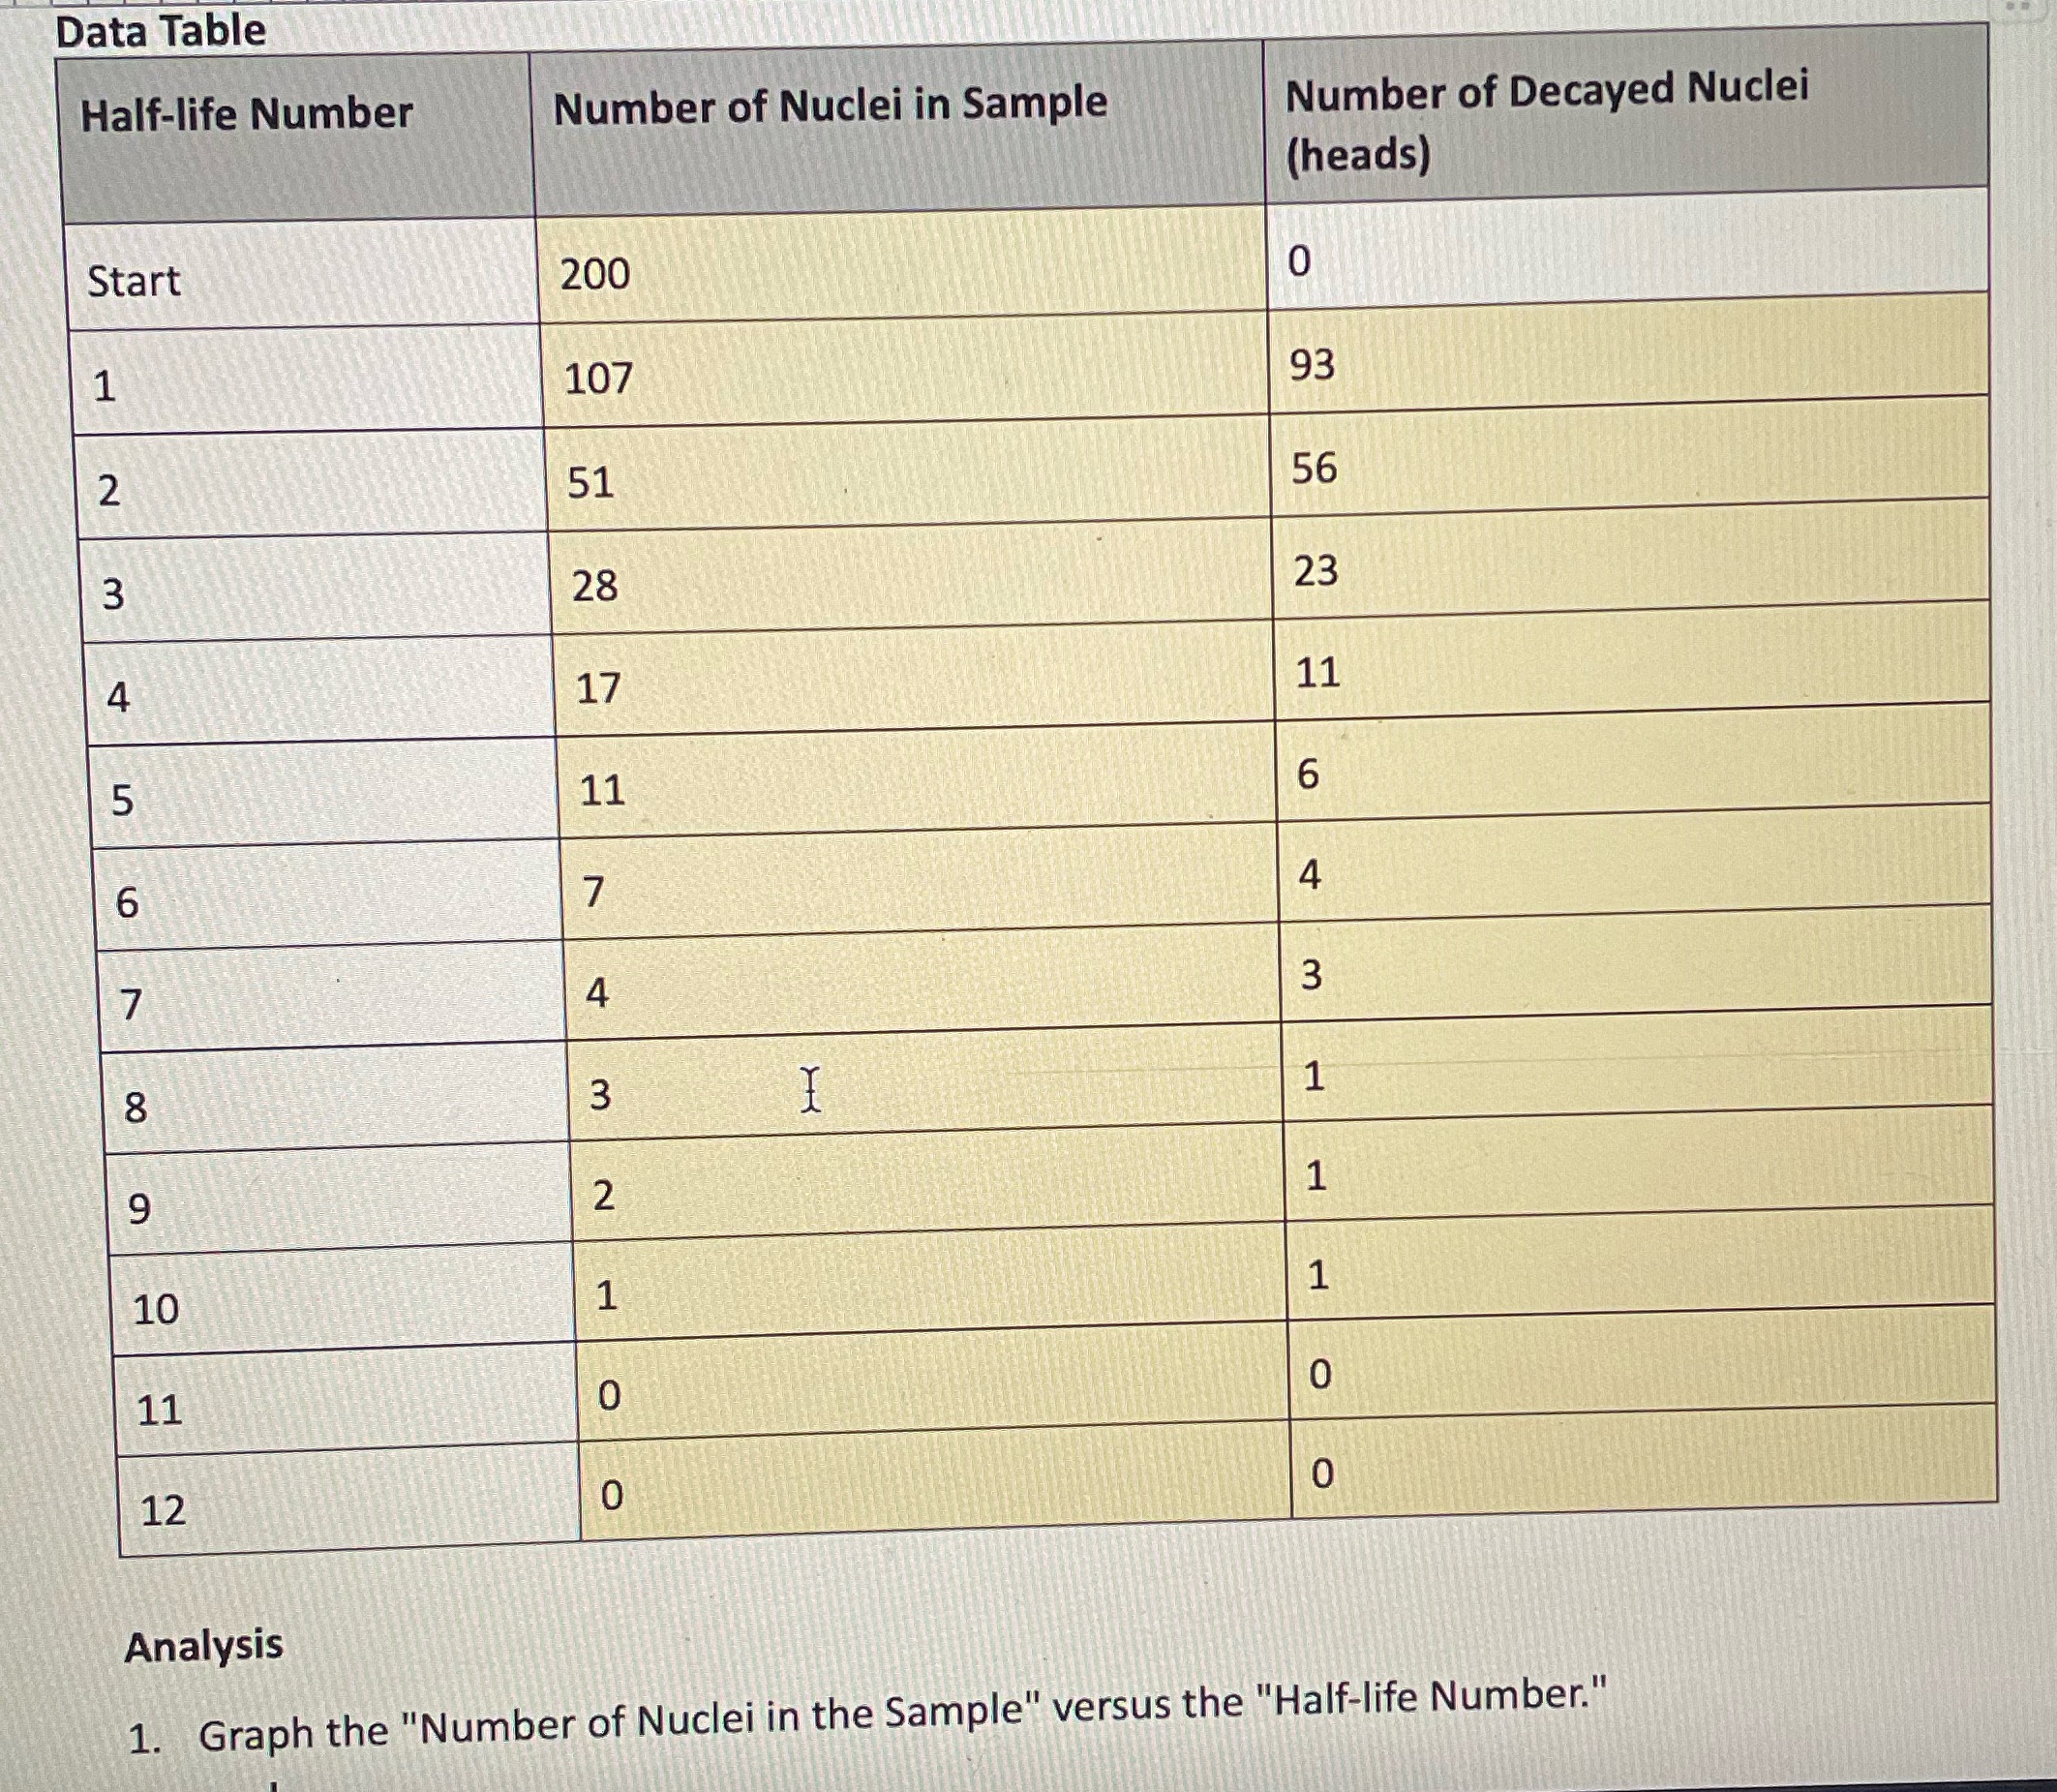
Data Table Half-life Number Number of Nuclei in Sample Number of Decayed Nuclei (heads) Start 200 0 1 107 93 2 51 56 3 28 23 4 17 11 5 11 6 6 7 4 4 3 8 1 9 2 10 11 0 0 12 0 0 Analysis 1. Graph the "Number of Nuclei in the Sample" versus the "Half-life Number."
Step by Step Solution
There are 3 Steps involved in it
1 Expert Approved Answer
Step: 1 Unlock

Question Has Been Solved by an Expert!
Get step-by-step solutions from verified subject matter experts
Step: 2 Unlock
Step: 3 Unlock