

Question: Graph/Chart - 357 30- 25- 20- Probability % 15- 10- 5- B C D E 0- A A: -25% return B: -10% return C: 0%
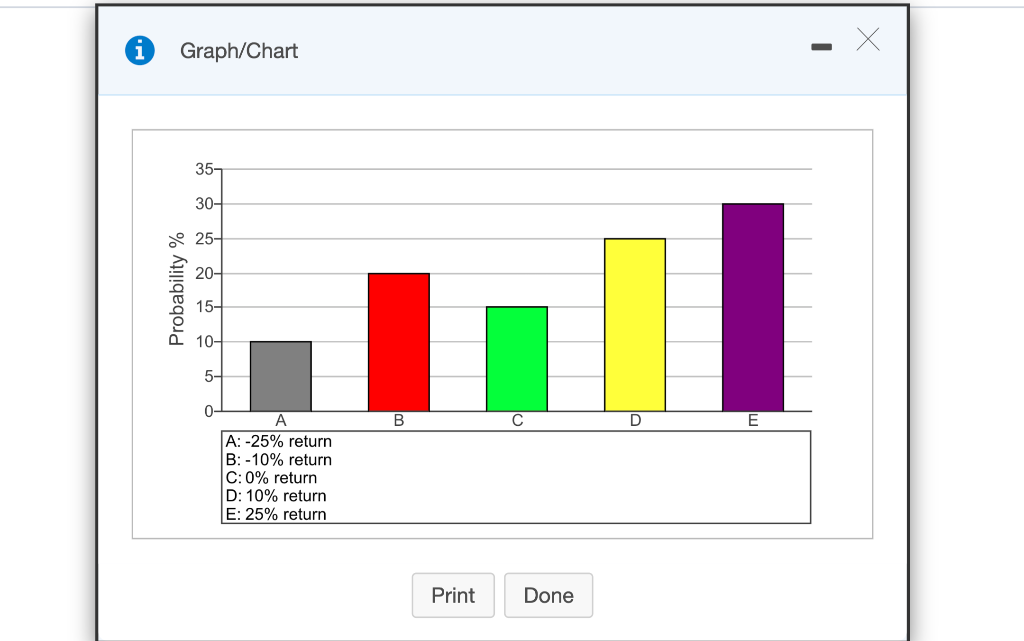
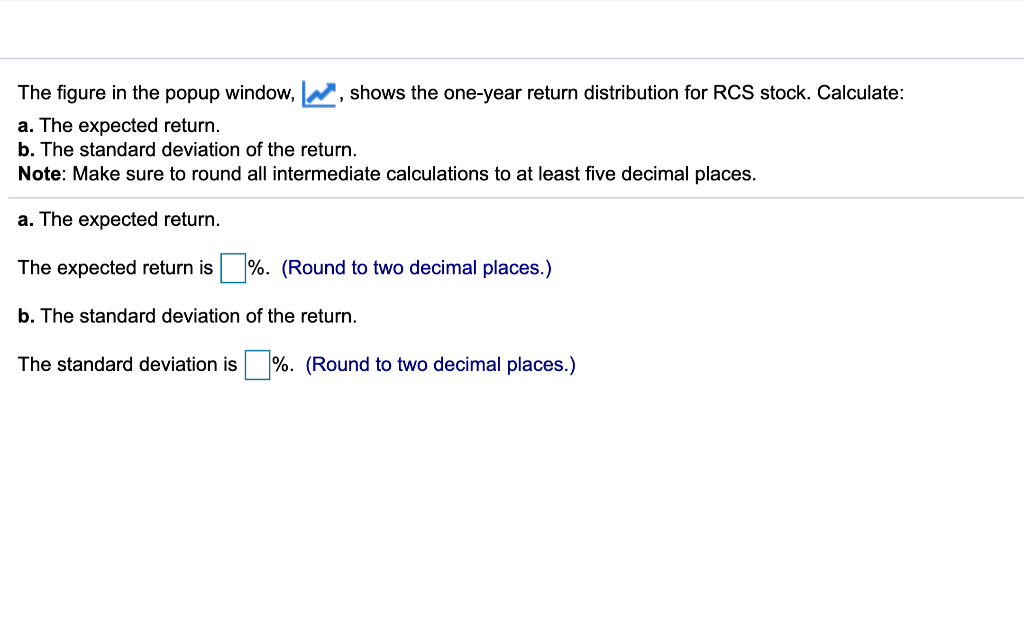
Graph/Chart - 357 30- 25- 20- Probability % 15- 10- 5- B C D E 0- A A: -25% return B: -10% return C: 0% return D: 10% return E: 25% return Print Done The figure in the popup window, IN, shows the one-year return distribution for RCS stock. Calculate: a. The expected return. b. The standard deviation of the return. Note: Make sure to round all intermediate calculations to at least five decimal places. a. The expected return. The expected return is %. (Round to two decimal places.) b. The standard deviation of the return. The standard deviation is \%. (Round to two decimal places.)
Step by Step Solution
There are 3 Steps involved in it
1 Expert Approved Answer
Step: 1 Unlock

Question Has Been Solved by an Expert!
Get step-by-step solutions from verified subject matter experts
Step: 2 Unlock
Step: 3 Unlock