

Question: Graph/chart 45- 40- 35- e 30- RCS Startup Inc. 25- Probability % 20- 15- 10- 5- Return -30% -15% 0% 15% 30% -80% -85% -60%
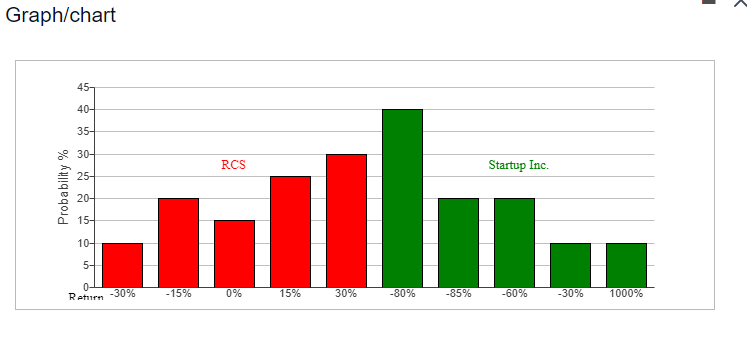
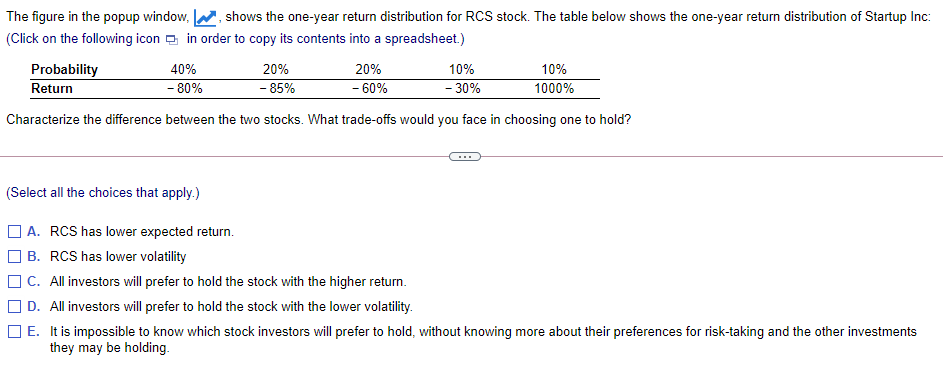
Graph/chart 45- 40- 35- e 30- RCS Startup Inc. 25- Probability % 20- 15- 10- 5- Return -30% -15% 0% 15% 30% -80% -85% -60% -30% 1000% The figure in the popup window, shows the one-year return distribution for RCS stock. The table below shows the one-year return distribution of Startup Inc: (Click on the following icon in order to copy its contents into a spreadsheet.) Probability 40% 20% 20% 10% 10% Return - 80% - 85% -60% -30% 1000% Characterize the difference between the two stocks. What trade-offs would you face in choosing one to hold? (Select all the choices that apply.) ] A. RCS has lower expected return. B. RCS has lower volatility OC. All investors will prefer to hold the stock with the higher return. D. All investors will prefer to hold the stock with the lower volatility. E. It is impossible to know which stock investors will prefer to hold, without knowing more about their preferences for risk-taking and the other investments they may be holding
Step by Step Solution
There are 3 Steps involved in it

Get step-by-step solutions from verified subject matter experts