

Question: : Graphical Analysis - K < Question 23, The cholesterol levels (in milligrams per 154 156 165 165 170 171 17 189 189 190
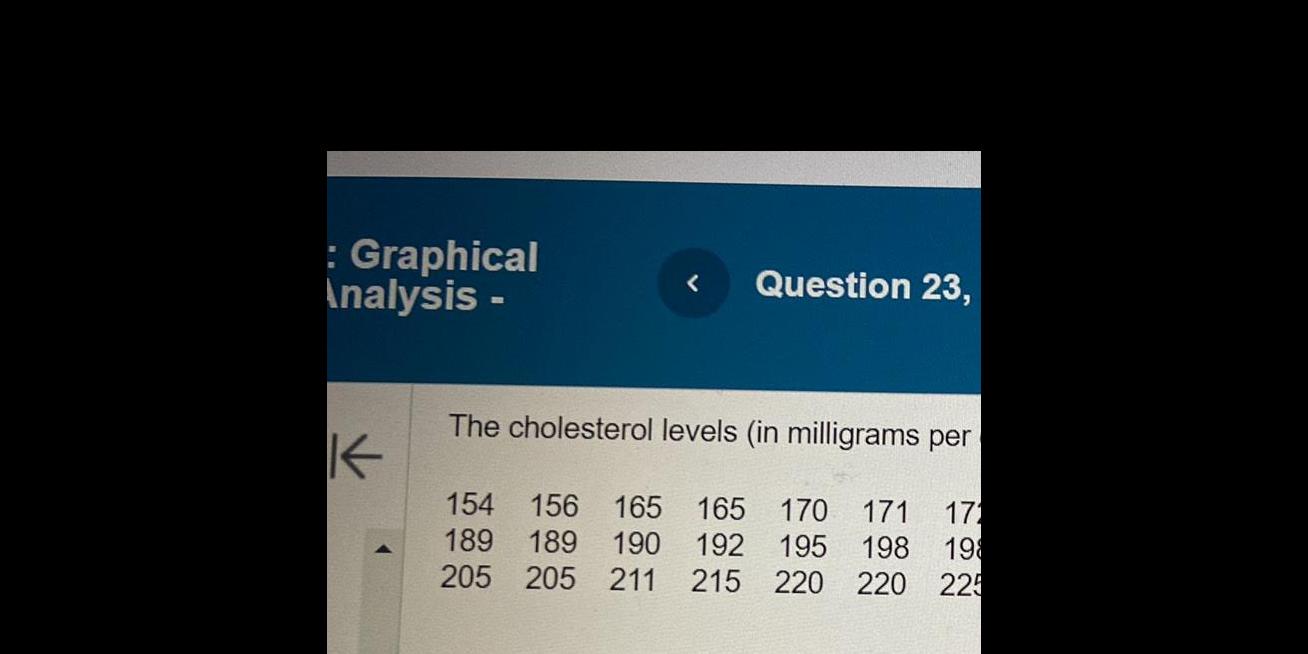
: Graphical Analysis - K < Question 23, The cholesterol levels (in milligrams per 154 156 165 165 170 171 17 189 189 190 192 195 198 198 205 205 211 215 220 220 225
Step by Step Solution
There are 3 Steps involved in it
1 Expert Approved Answer
Step: 1 Unlock

Question Has Been Solved by an Expert!
Get step-by-step solutions from verified subject matter experts
Step: 2 Unlock
Step: 3 Unlock