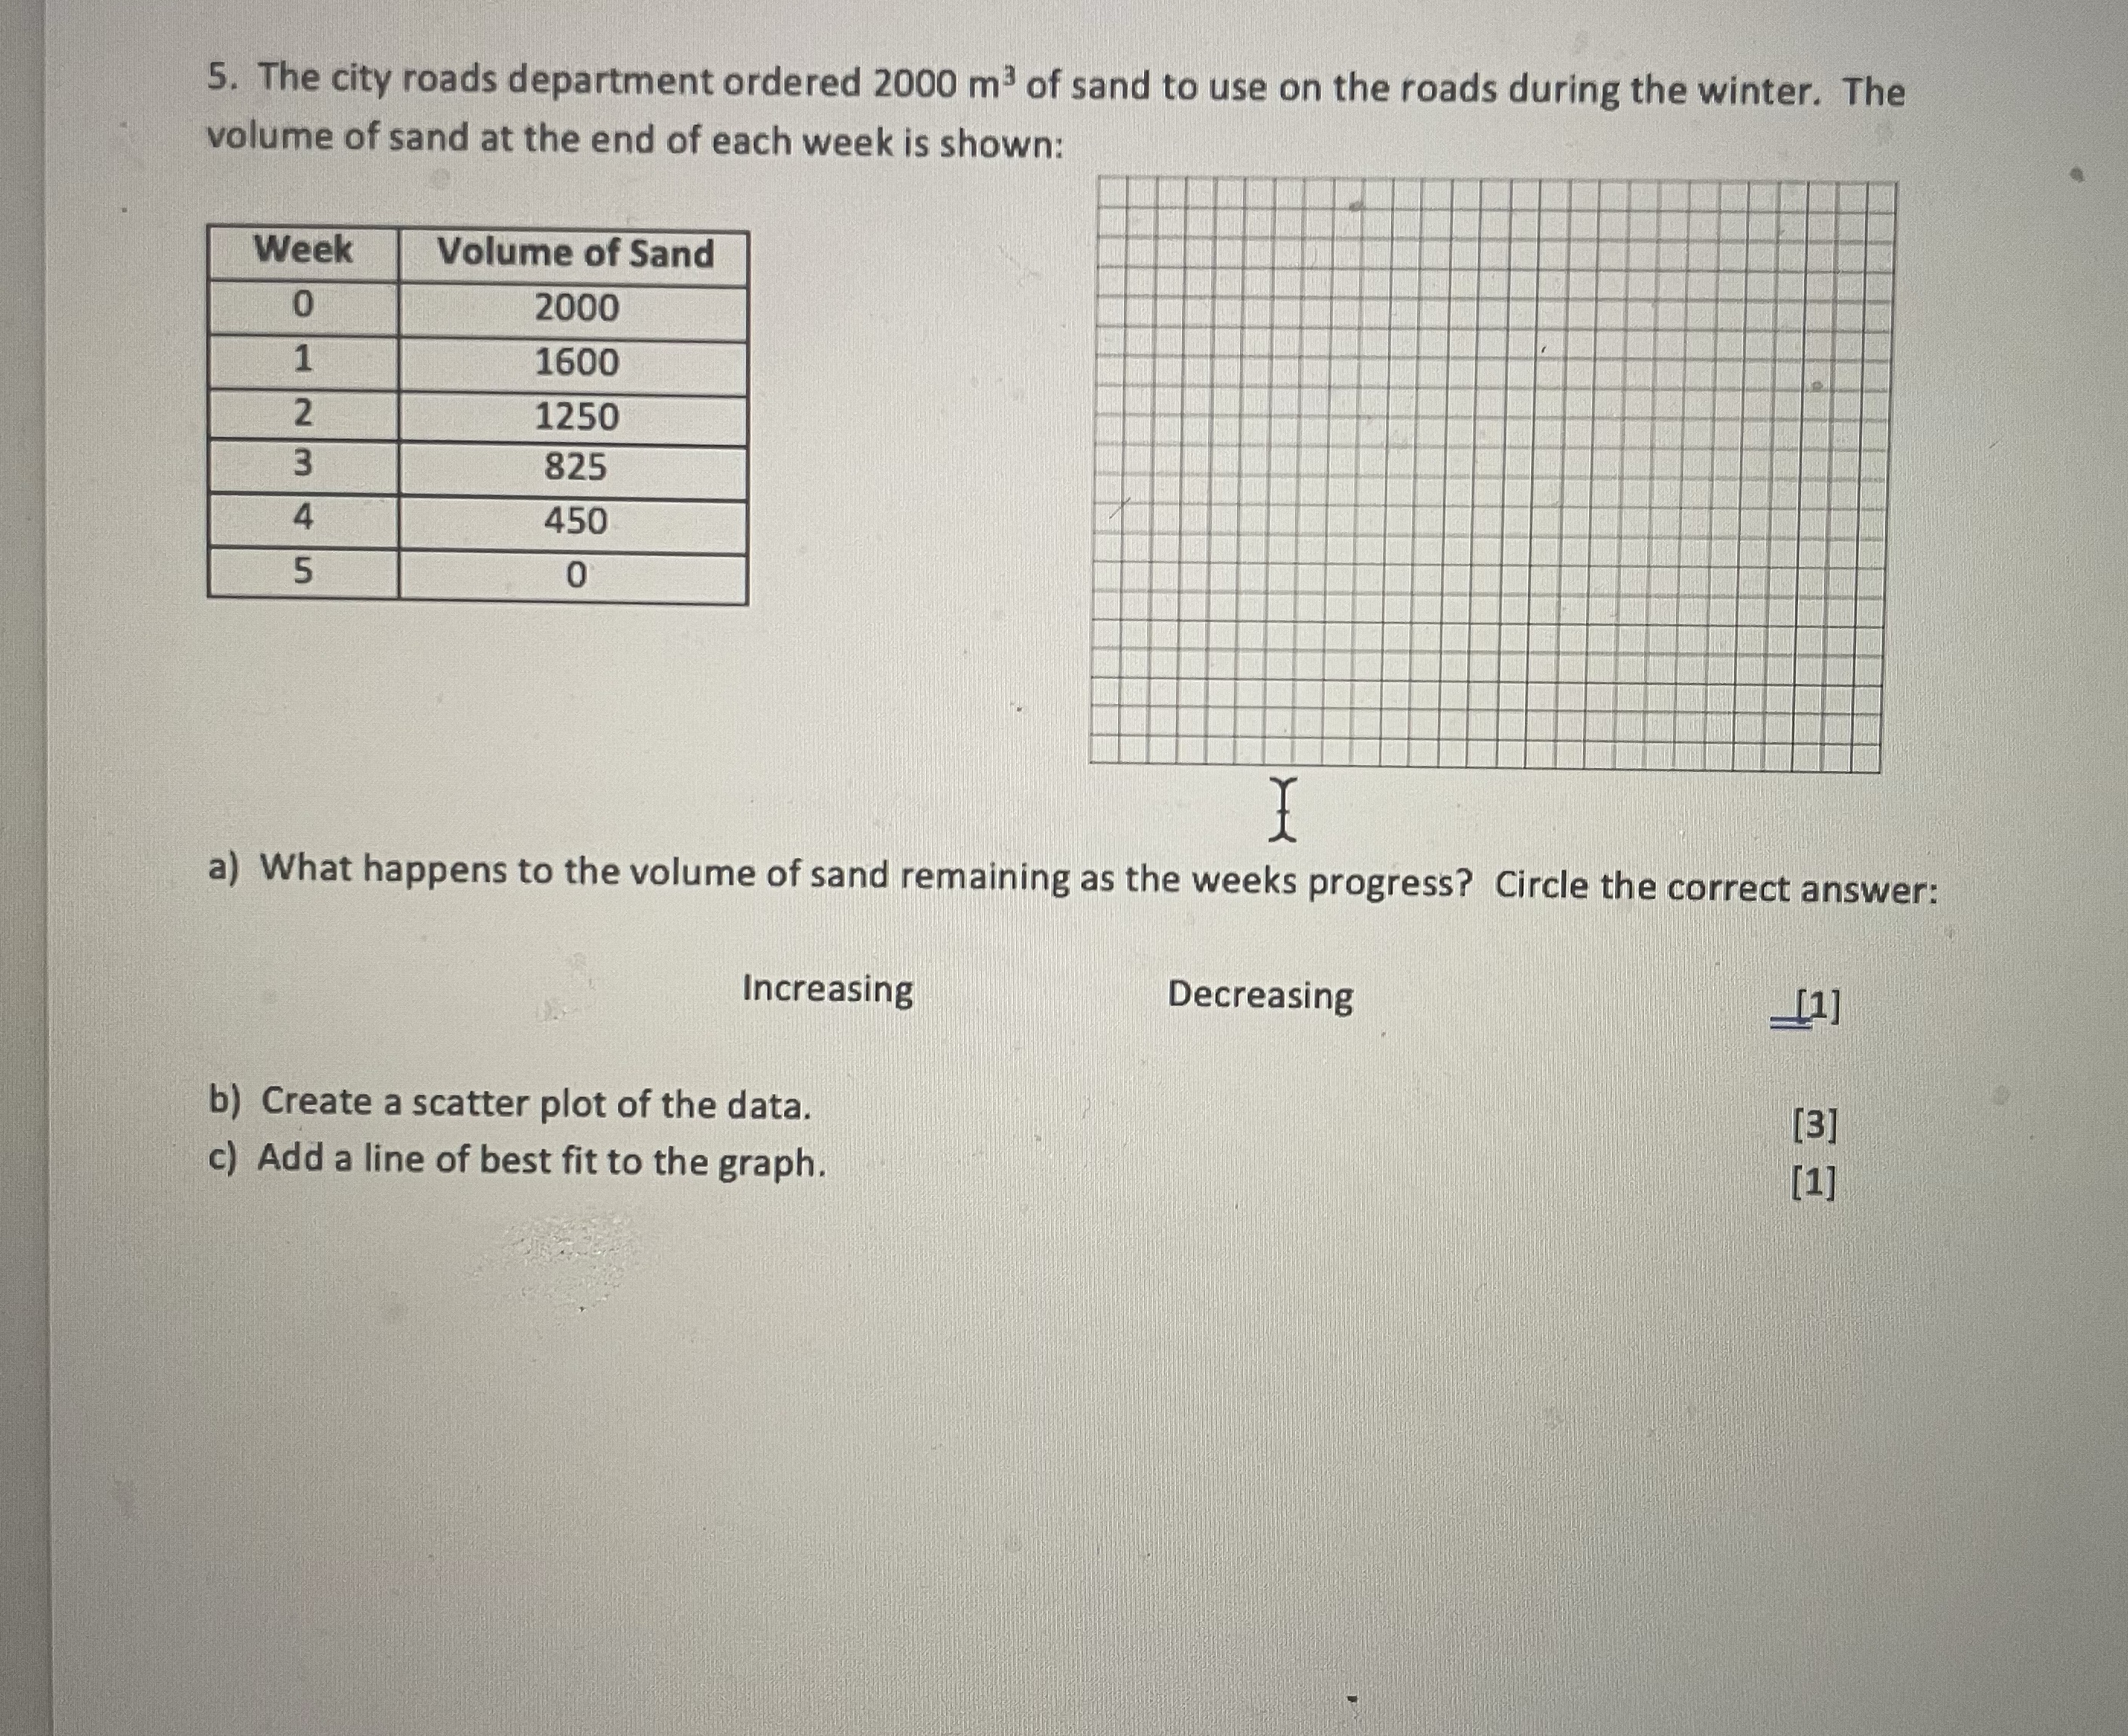
Question: graphical models 5. The city roads department ordered 2000 m3 of sand to use on the roads during the winter. The volume of sand at

graphical models

graphical models 5. The city roads department
5. The city roads department ordered 2000 m3 of sand to use on the roads during the winter. The volume of sand at the end of each week is shown: Week Volume of Sand 0 2000 1600 1250 825 UI AWN 450 0 I a) What happens to the volume of sand remaining as the weeks progress? Circle the correct answer: Increasing Decreasing [1] b) Create a scatter plot of the data. [3] c) Add a line of best fit to the graph. [1]

Step by Step Solution

There are 3 Steps involved in it

1 Expert Approved Answer
Step: 1 Unlock blur-text-image
Question Has Been Solved by an Expert!

Get step-by-step solutions from verified subject matter experts

Step: 2 Unlock
Step: 3 Unlock

Students Have Also Explored These Related Mathematics Questions!