

Question: graphically plot the total costs Creative Design makes intricate jewelry out of precious metal. The company is introducing a new line and needs to select
graphically plot the total costs 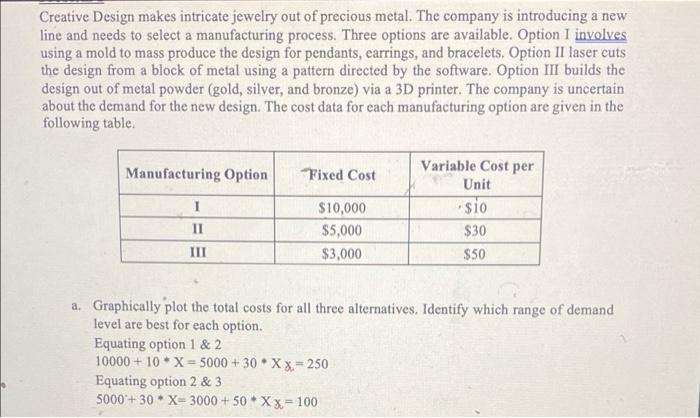
Creative Design makes intricate jewelry out of precious metal. The company is introducing a new line and needs to select a manufacturing process. Three options are available. Option I involves using a mold to mass produce the design for pendants, earrings, and bracelets. Option II laser cuts the design from a block of metal using a pattern directed by the software. Option III builds the design out of metal powder (gold, silver, and bronze) via a 3D printer. The company is uncertain about the demand for the new design. The cost data for each manufacturing option are given in the following table. Manufacturing Option Fixed Cost 1 Variable Cost per Unit $io $30 $50 $10,000 $5,000 $3,000 II III a. Graphically plot the total costs for all three alternatives. Identify which range of demand level are best for each option. Equating option 1 & 2 10000 + 10 * X= 5000 + 30.X X=250 Equating option 2 & 3 5000+30 * X=3000 + 50 * Xx= 100 Step by Step Solution
There are 3 Steps involved in it
1 Expert Approved Answer
Step: 1 Unlock

Question Has Been Solved by an Expert!
Get step-by-step solutions from verified subject matter experts
Step: 2 Unlock
Step: 3 Unlock