

Question: (Graphical/Short Answer): The figure below shows the total growth function or the relationship between timber volume and time (in years). Draw a corresponding graph that
(Graphical/Short Answer): The figure below shows the total growth function or the relationship between timber volume and time (in years). Draw a corresponding graph that shows time on the horizontal axis and growth per year (not total volume) on the vertical axis. Assuming that money invested in trees could instead be used for alternative investments with a constant rate of return, explain why the optimal harvest is unlikely to occur at the highest point on either the figure below or the graph you drew.
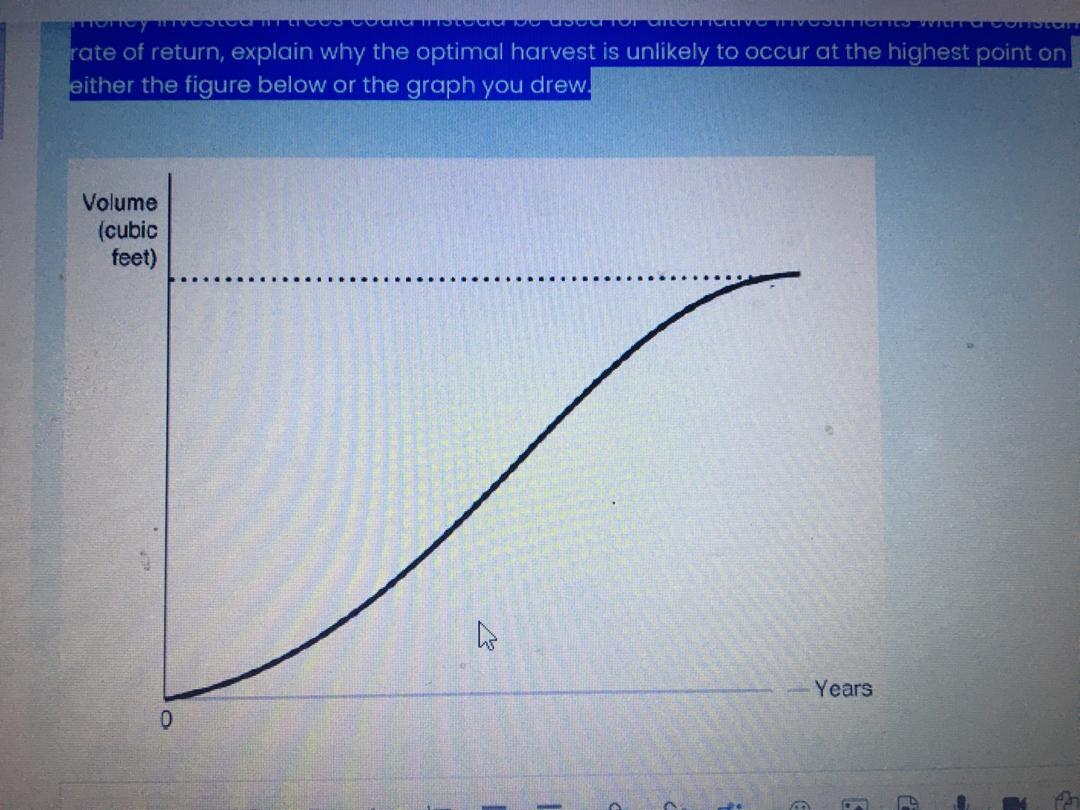
rate of return, explain why the optimal harvest is unlikely to occur at the highest point on either the figure below or the graph you drew. Volume (cubic feet) Years 0
Step by Step Solution
There are 3 Steps involved in it

Get step-by-step solutions from verified subject matter experts