

Question: GRAPHICS AND VISUALIZATION Objectives: 1. To use Scilab for creating 2D graphics data and plotting 2D and 3D graphs 2. To use graphic/drawing software
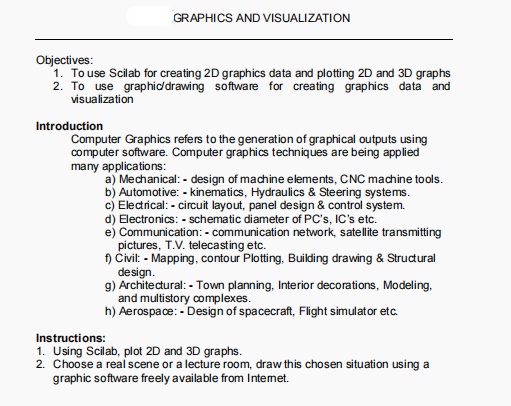
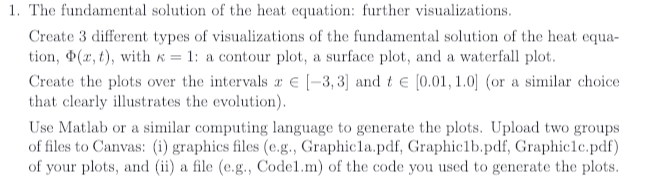
GRAPHICS AND VISUALIZATION Objectives: 1. To use Scilab for creating 2D graphics data and plotting 2D and 3D graphs 2. To use graphic/drawing software for creating graphics data and visualization Introduction Computer Graphics refers to the generation of graphical outputs using computer software. Computer graphics techniques are being applied many applications: a) Mechanical:- design of machine elements, CNC machine tools. b) Automotive: - kinematics, Hydraulics & Steering systems. c) Electrical: - circuit layout, panel design & control system. d) Electronics: - schematic diameter of PC's, IC's etc. e) Communication: - communication network, satellite transmitting pictures, T.V. telecasting etc. f) Civil: - Mapping, contour Plotting, Building drawing & Structural design. g) Architectural: - Town planning, Interior decorations, Modeling, and multistory complexes. h) Aerospace:- Design of spacecraft, Flight simulator etc. Instructions: 1. Using Scilab, plot 2D and 3D graphs. 2. Choose a real scene or a lecture room, draw this chosen situation using a graphic software freely available from Intemet. 1. The fundamental solution of the heat equation: further visualizations. Create 3 different types of visualizations of the fundamental solution of the heat equa- tion, $(x, t), with = 1: a contour plot, a surface plot, and a waterfall plot. Create the plots over the intervals a [-3,3] and t [0.01, 1.0] (or a similar choice that clearly illustrates the evolution). Use Matlab or a similar computing language to generate the plots. Upload two groups of files to Canvas: (i) graphics files (e.g., Graphicla.pdf, Graphic1b.pdf, Graphic1c.pdf) of your plots, and (ii) a file (e.g., Code1.m) of the code you used to generate the plots.
Step by Step Solution
There are 3 Steps involved in it

Get step-by-step solutions from verified subject matter experts