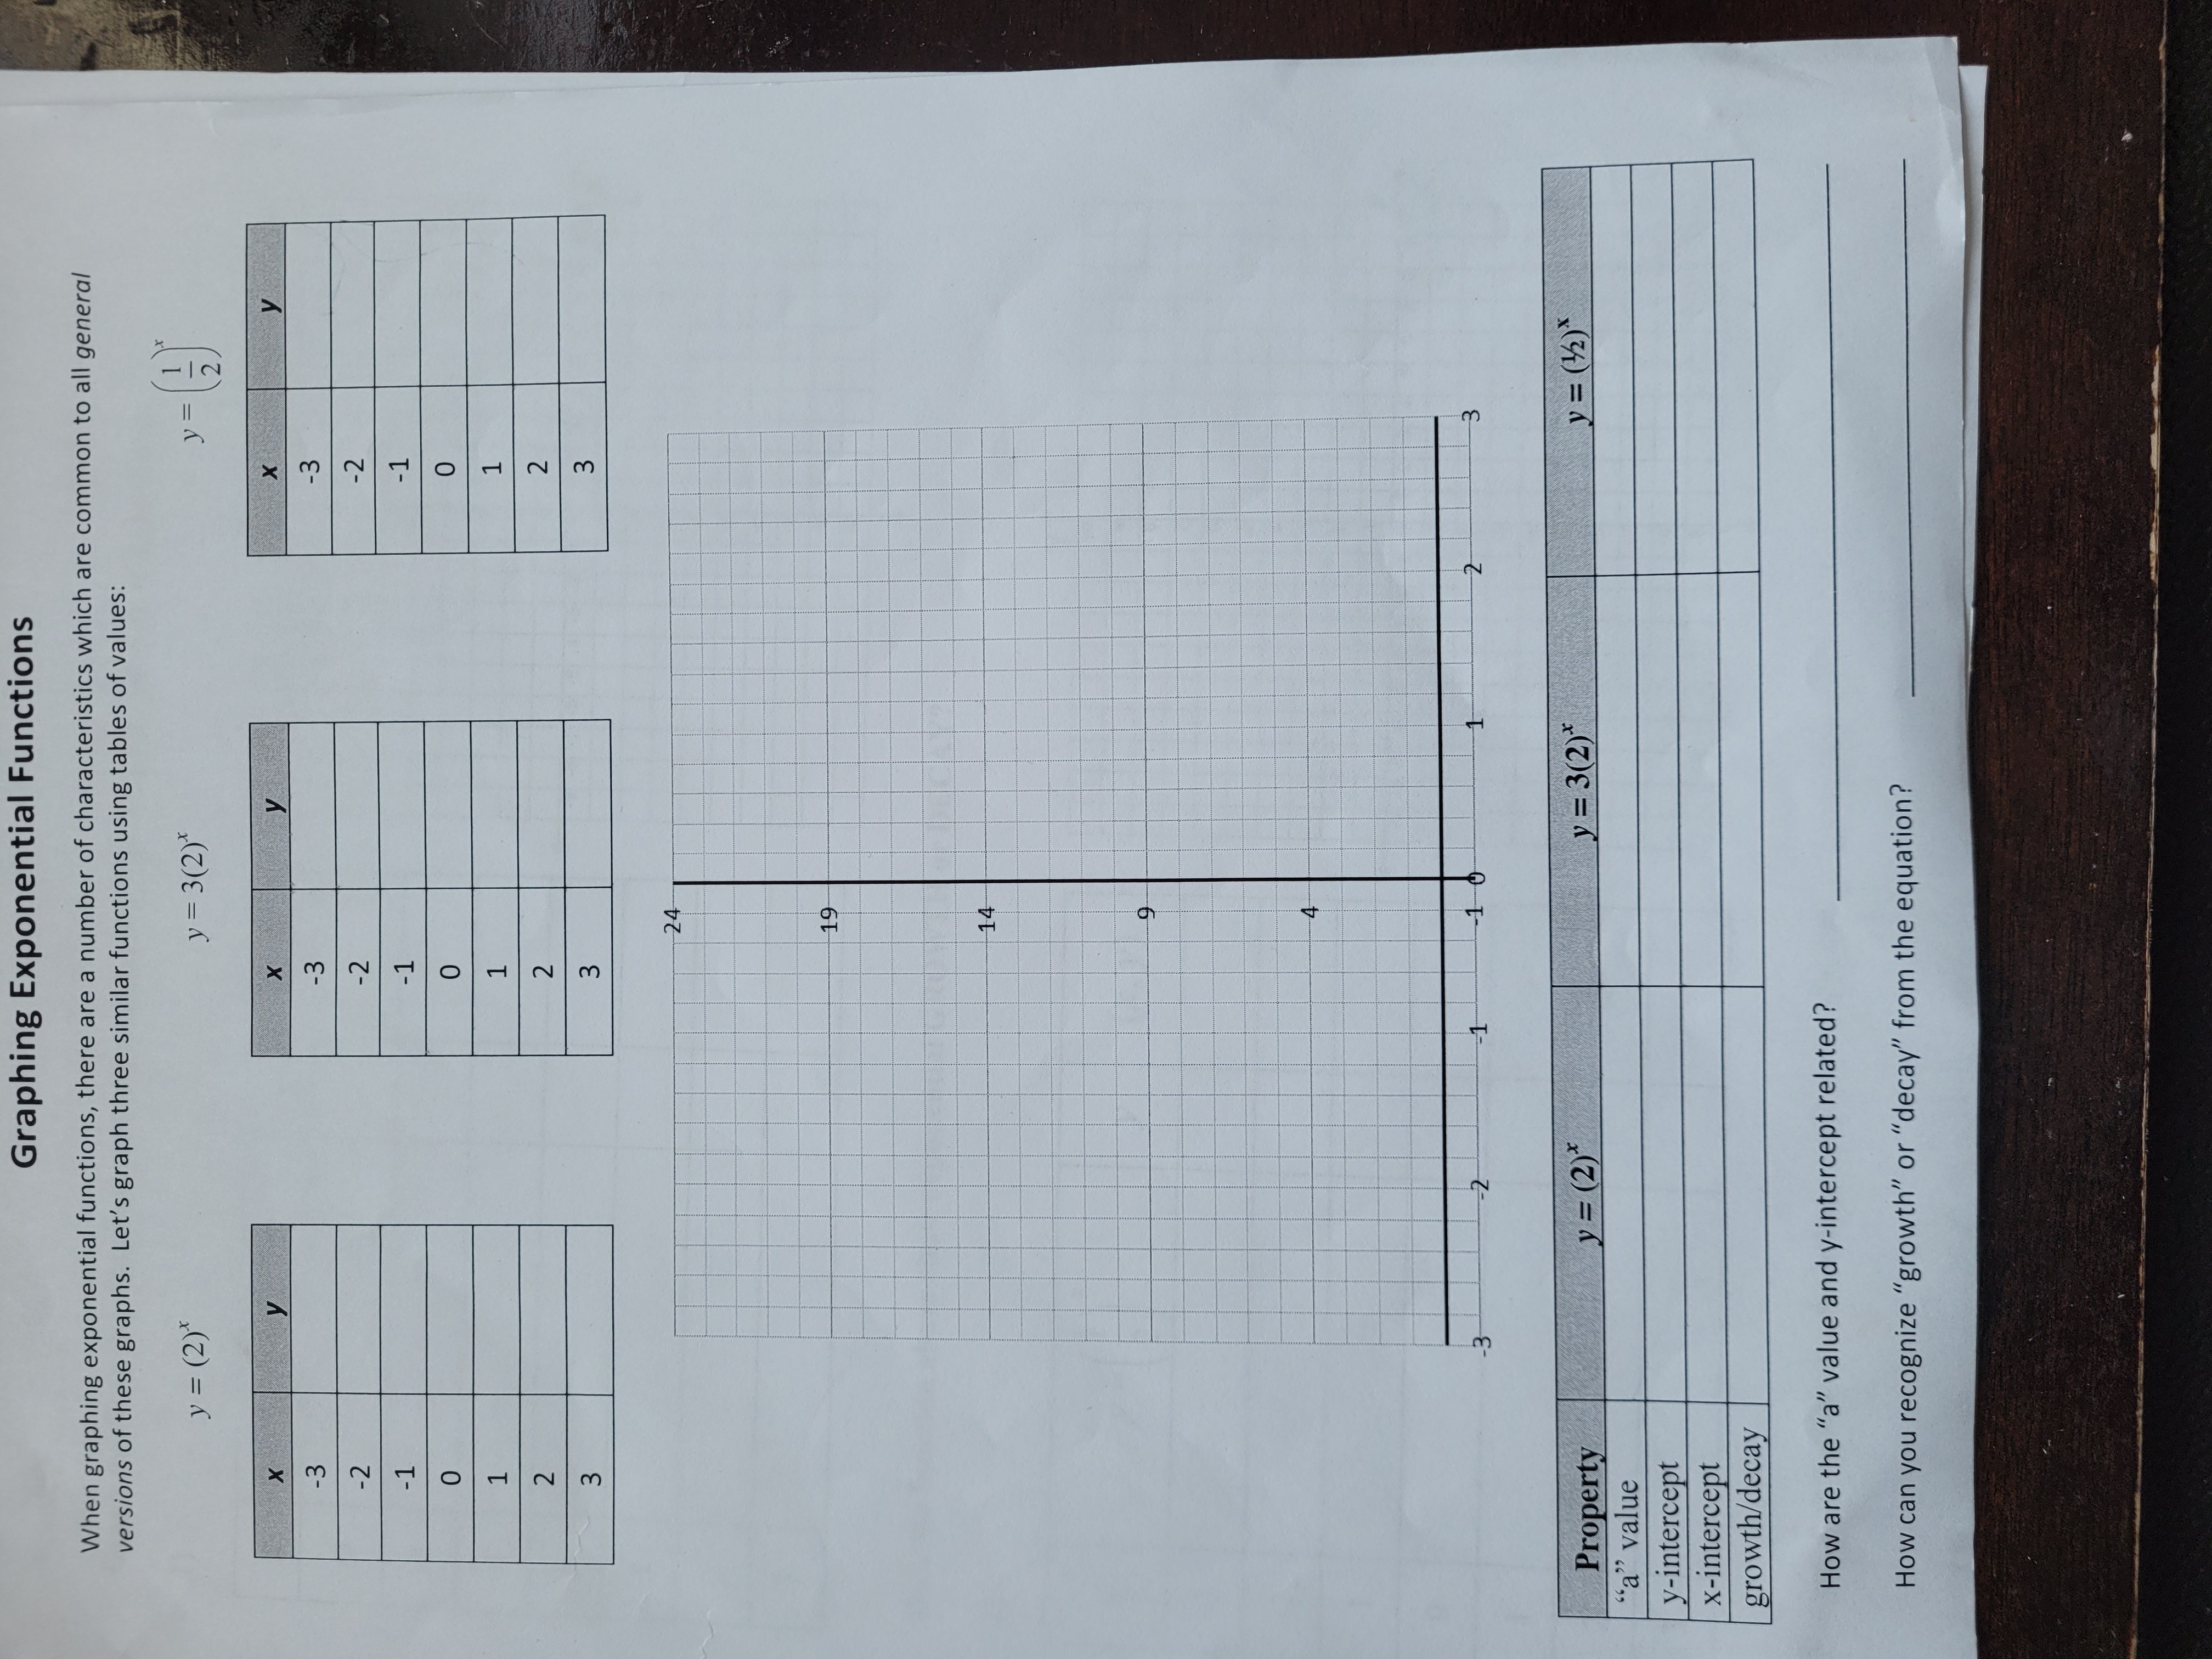
Question: Graphing Exponential Functions When graphing exponential functions, there are a number of characteristics which are common to all general versions of these graphs. Let's graph

Graphing Exponential Functions When graphing
Graphing Exponential Functions When graphing exponential functions, there are a number of characteristics which are common to all general versions of these graphs. Let's graph three similar functions using tables of values: y = (2 ) * y = 3 ( 2 ) * NI - X X X y - 3 - 3 - 3 - 2 - 2 - 2 -1 - 1 - 1 0 0 0 W N - W N H W N I 24 19 14 9 3 --2 - 1 1- Property y = (2)* y = 3(2)* y = (12) * "a" value y-intercept x-intercept growth/decay How are the "a" value and y-intercept related? How can you recognize "growth" or "decay" from the equation

Step by Step Solution

There are 3 Steps involved in it

1 Expert Approved Answer
Step: 1 Unlock blur-text-image
Question Has Been Solved by an Expert!

Get step-by-step solutions from verified subject matter experts

Step: 2 Unlock
Step: 3 Unlock

Students Have Also Explored These Related Mathematics Questions!