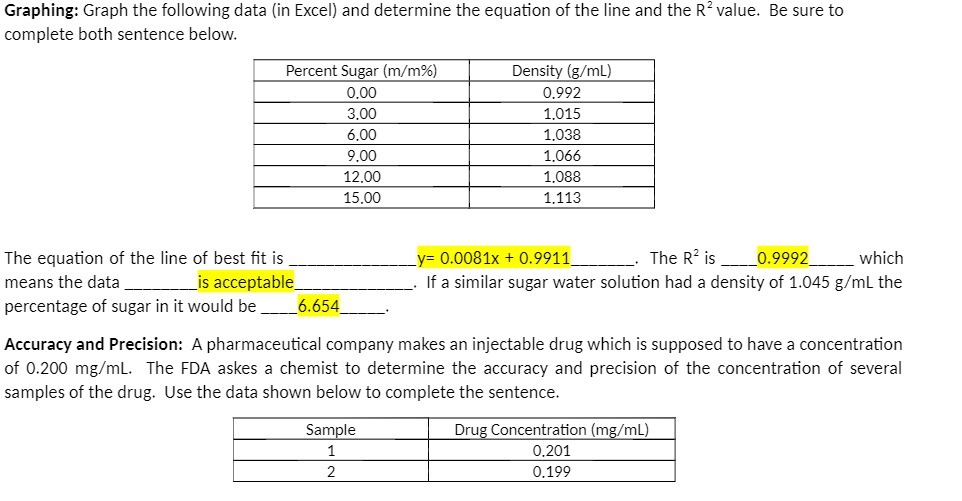
Question: Graphing: Graph the following data (in Excel) and determine the equation of the line and the R value. Be sure to complete both sentence below.

Graphing: Graph the following data (in Excel) and
Graphing: Graph the following data (in Excel) and determine the equation of the line and the R value. Be sure to complete both sentence below. Percent Sugar (m/m%) Density (g/ml) 0.00 0.992 3.00 1.015 6.00 1.038 9,00 1.066 12.00 1.088 15,00 1.113 The equation of the line of best fit is y= 0.0081x + 0.9911 The R is 0.9992 which means the data is acceptable If a similar sugar water solution had a density of 1.045 g/ml the percentage of sugar in it would be 6.654 Accuracy and Precision: A pharmaceutical company makes an injectable drug which is supposed to have a concentration of 0.200 mg/ml. The FDA askes a chemist to determine the accuracy and precision of the concentration of several samples of the drug. Use the data shown below to complete the sentence. Sample Drug Concentration (mg/ml) 1 0.201 2 0.199

Step by Step Solution

There are 3 Steps involved in it

1 Expert Approved Answer
Step: 1 Unlock blur-text-image
Question Has Been Solved by an Expert!

Get step-by-step solutions from verified subject matter experts

Step: 2 Unlock
Step: 3 Unlock

Students Have Also Explored These Related Mathematics Questions!