

Question: GRAPHING THE DEMAND AND SUPPLY Instruction: Plot the demand and supply curve using a graphing paper. Scenario: You are a BSBA student enrolled in
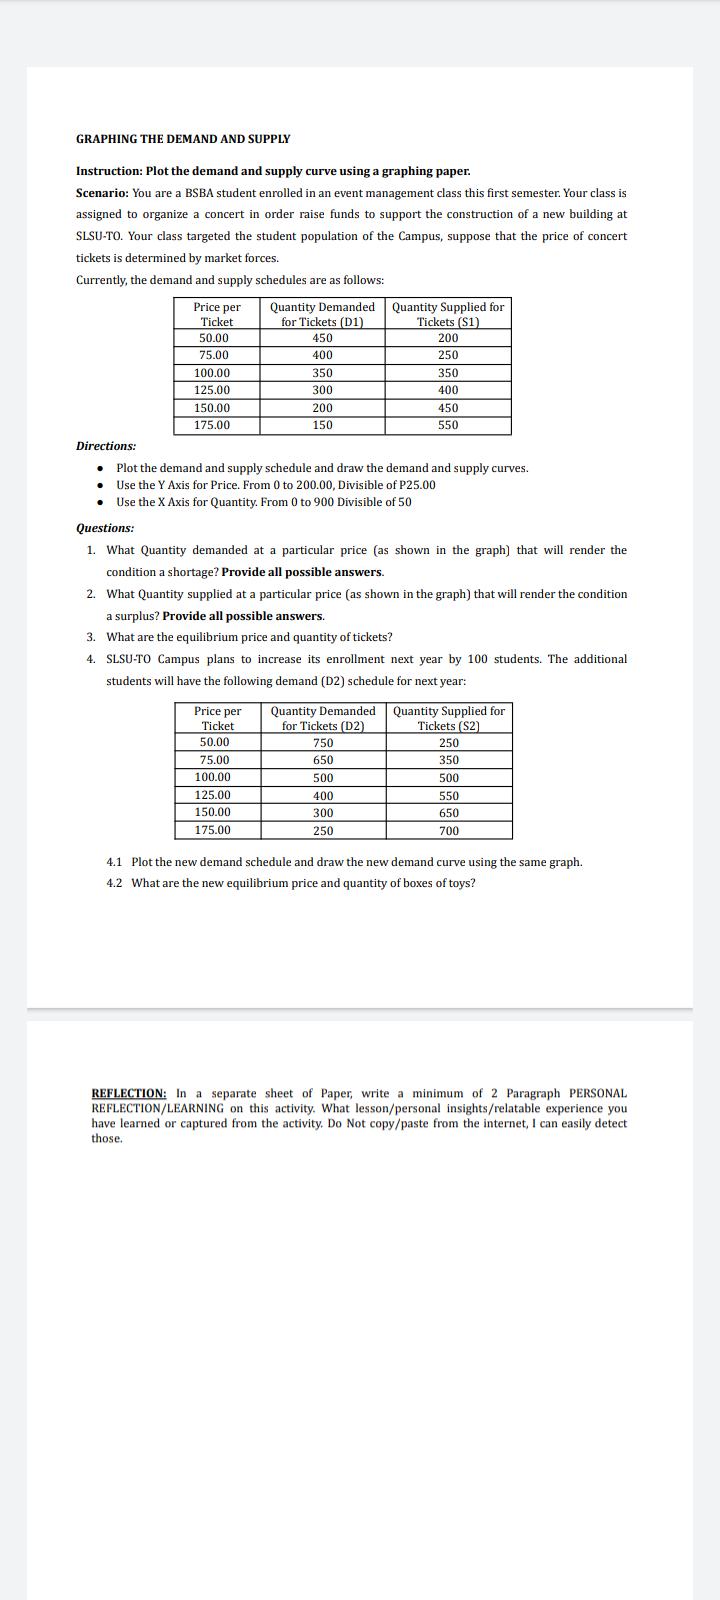
GRAPHING THE DEMAND AND SUPPLY Instruction: Plot the demand and supply curve using a graphing paper. Scenario: You are a BSBA student enrolled in an event management class this first semester. Your class is assigned to organize a concert in order raise funds to support the construction of a new building at SLSU-TO. Your class targeted the student population of the Campus, suppose that the price of concert tickets is determined by market forces. Currently, the demand and supply schedules are as follows: ITT Price per Ticket Quantity Demanded Quantity Supplied for Tickets (S1) for Tickets (D1) 450 50.00 200 75.00 400 250 100.00 350 350 125.00 300 400 150.00 200 450 175.00 150 550 Directions: Plot the demand and supply schedule and draw the demand and supply curves. Use the Y Axis for Price. From 0 to 200.00, Divisible of P25.00 Use the X Axis for Quantity. From 0 to 900 Divisible of 50 Questions: 1. What Quantity demanded at a particular price (as shown in the graph) that will render the condition a shortage? Provide all possible answers. 2. What Quantity supplied at a particular price (as shown in the graph) that will render the condition a surplus? Provide all possible answers. 3. What are the equilibrium price and quantity of tickets? 4. SLSU-TO Campus plans to increase its enrollment next year by 100 students. The additional students will have the following demand (D2) schedule for next year: Price per Ticket 50,00 Quantity Demanded for Tickets (D2) Quantity Supplied for Tickets (S2) 750 250 75.00 650 350 100.00 500 500 125.00 400 550 150.00 300 650 175.00 250 700 4.1 Plot the new demand schedule and draw the new demand curve using the same graph. 4.2 What are the new equilibrium price and quantity of boxes of toys? REFLECTION: In a separate sheet of Paper, write a minimum of 2 Paragraph PERSONAL REFLECTION/LEARNING on this activity. What lesson/personal insights/relatable experience you have learned or captured from the activity. Do Not copy/paste from the internet, I can easily detect those.
Step by Step Solution
3.36 Rating (171 Votes )
There are 3 Steps involved in it
1The condition of shortage of demand is occures in two ... View full answer

Get step-by-step solutions from verified subject matter experts