

Question: Graphing Transformations of Absolute Value Functions The graph f(a) = x2 is shown below. Let g(x) =3 f(x) . Draw the graph of g(x) and
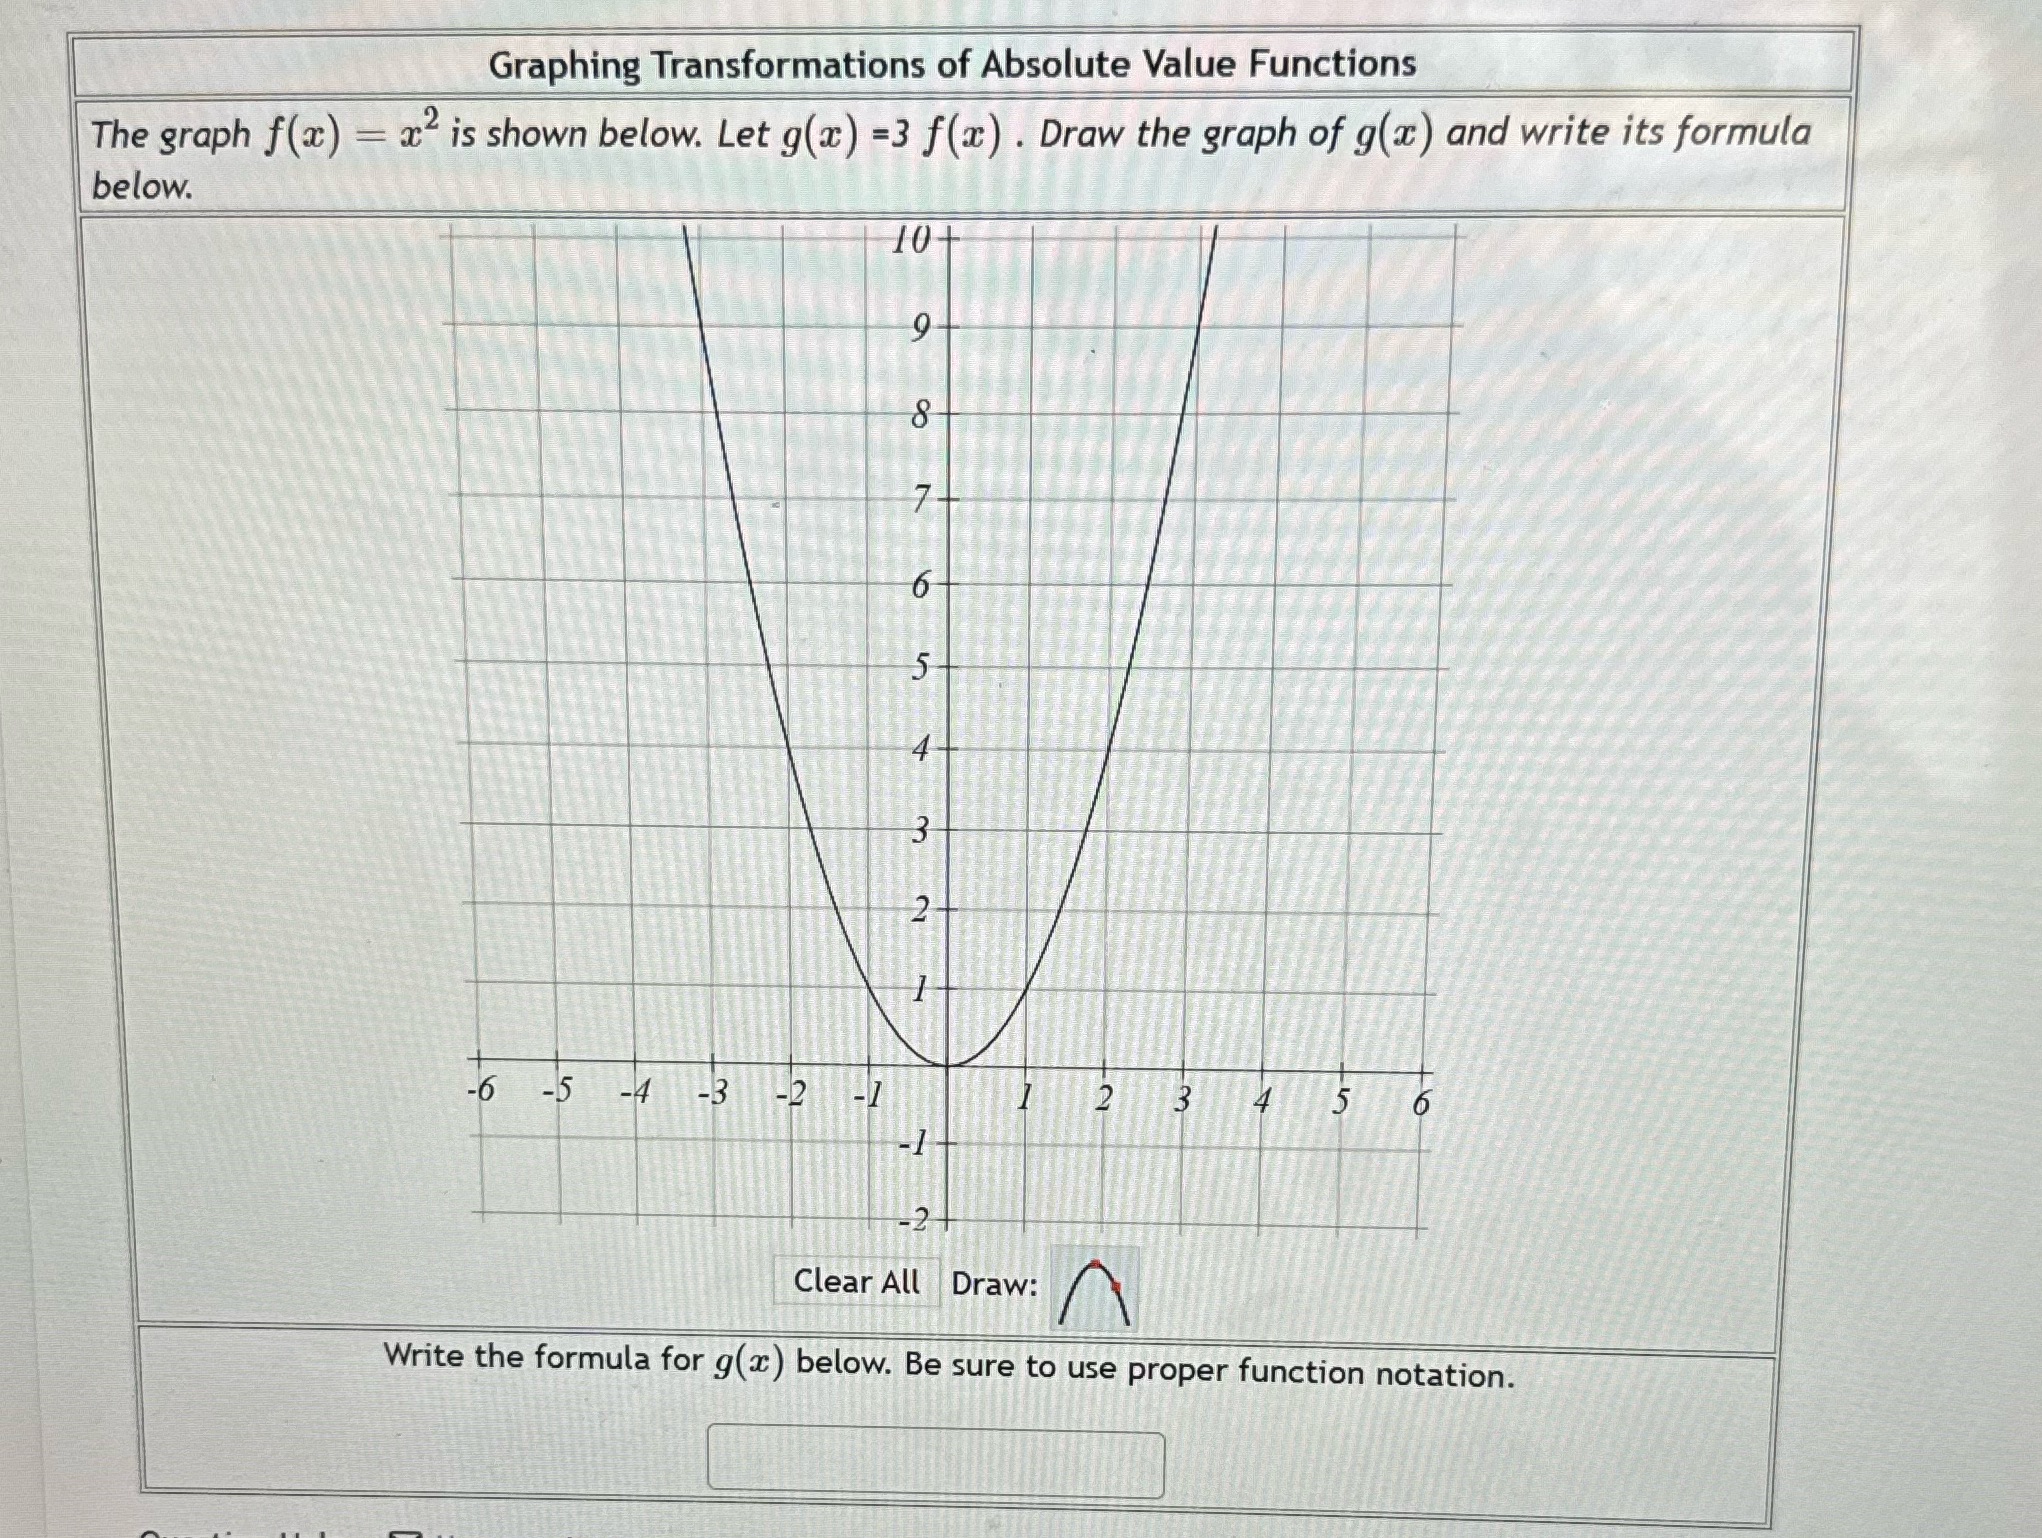
Graphing Transformations of Absolute Value Functions The graph f(a) = x2 is shown below. Let g(x) =3 f(x) . Draw the graph of g(x) and write its formula below. 10- 8 -6 -5 -4 -3 -2 -1 1 Clear All Draw: Write the formula for g(x) below. Be sure to use proper function notation
Step by Step Solution
There are 3 Steps involved in it
1 Expert Approved Answer
Step: 1 Unlock

Question Has Been Solved by an Expert!
Get step-by-step solutions from verified subject matter experts
Step: 2 Unlock
Step: 3 Unlock