

Question: Graphs and Descriptive Statistics In this lab, we will investigate how changing the size and number of the classes changes the shape of the histogram
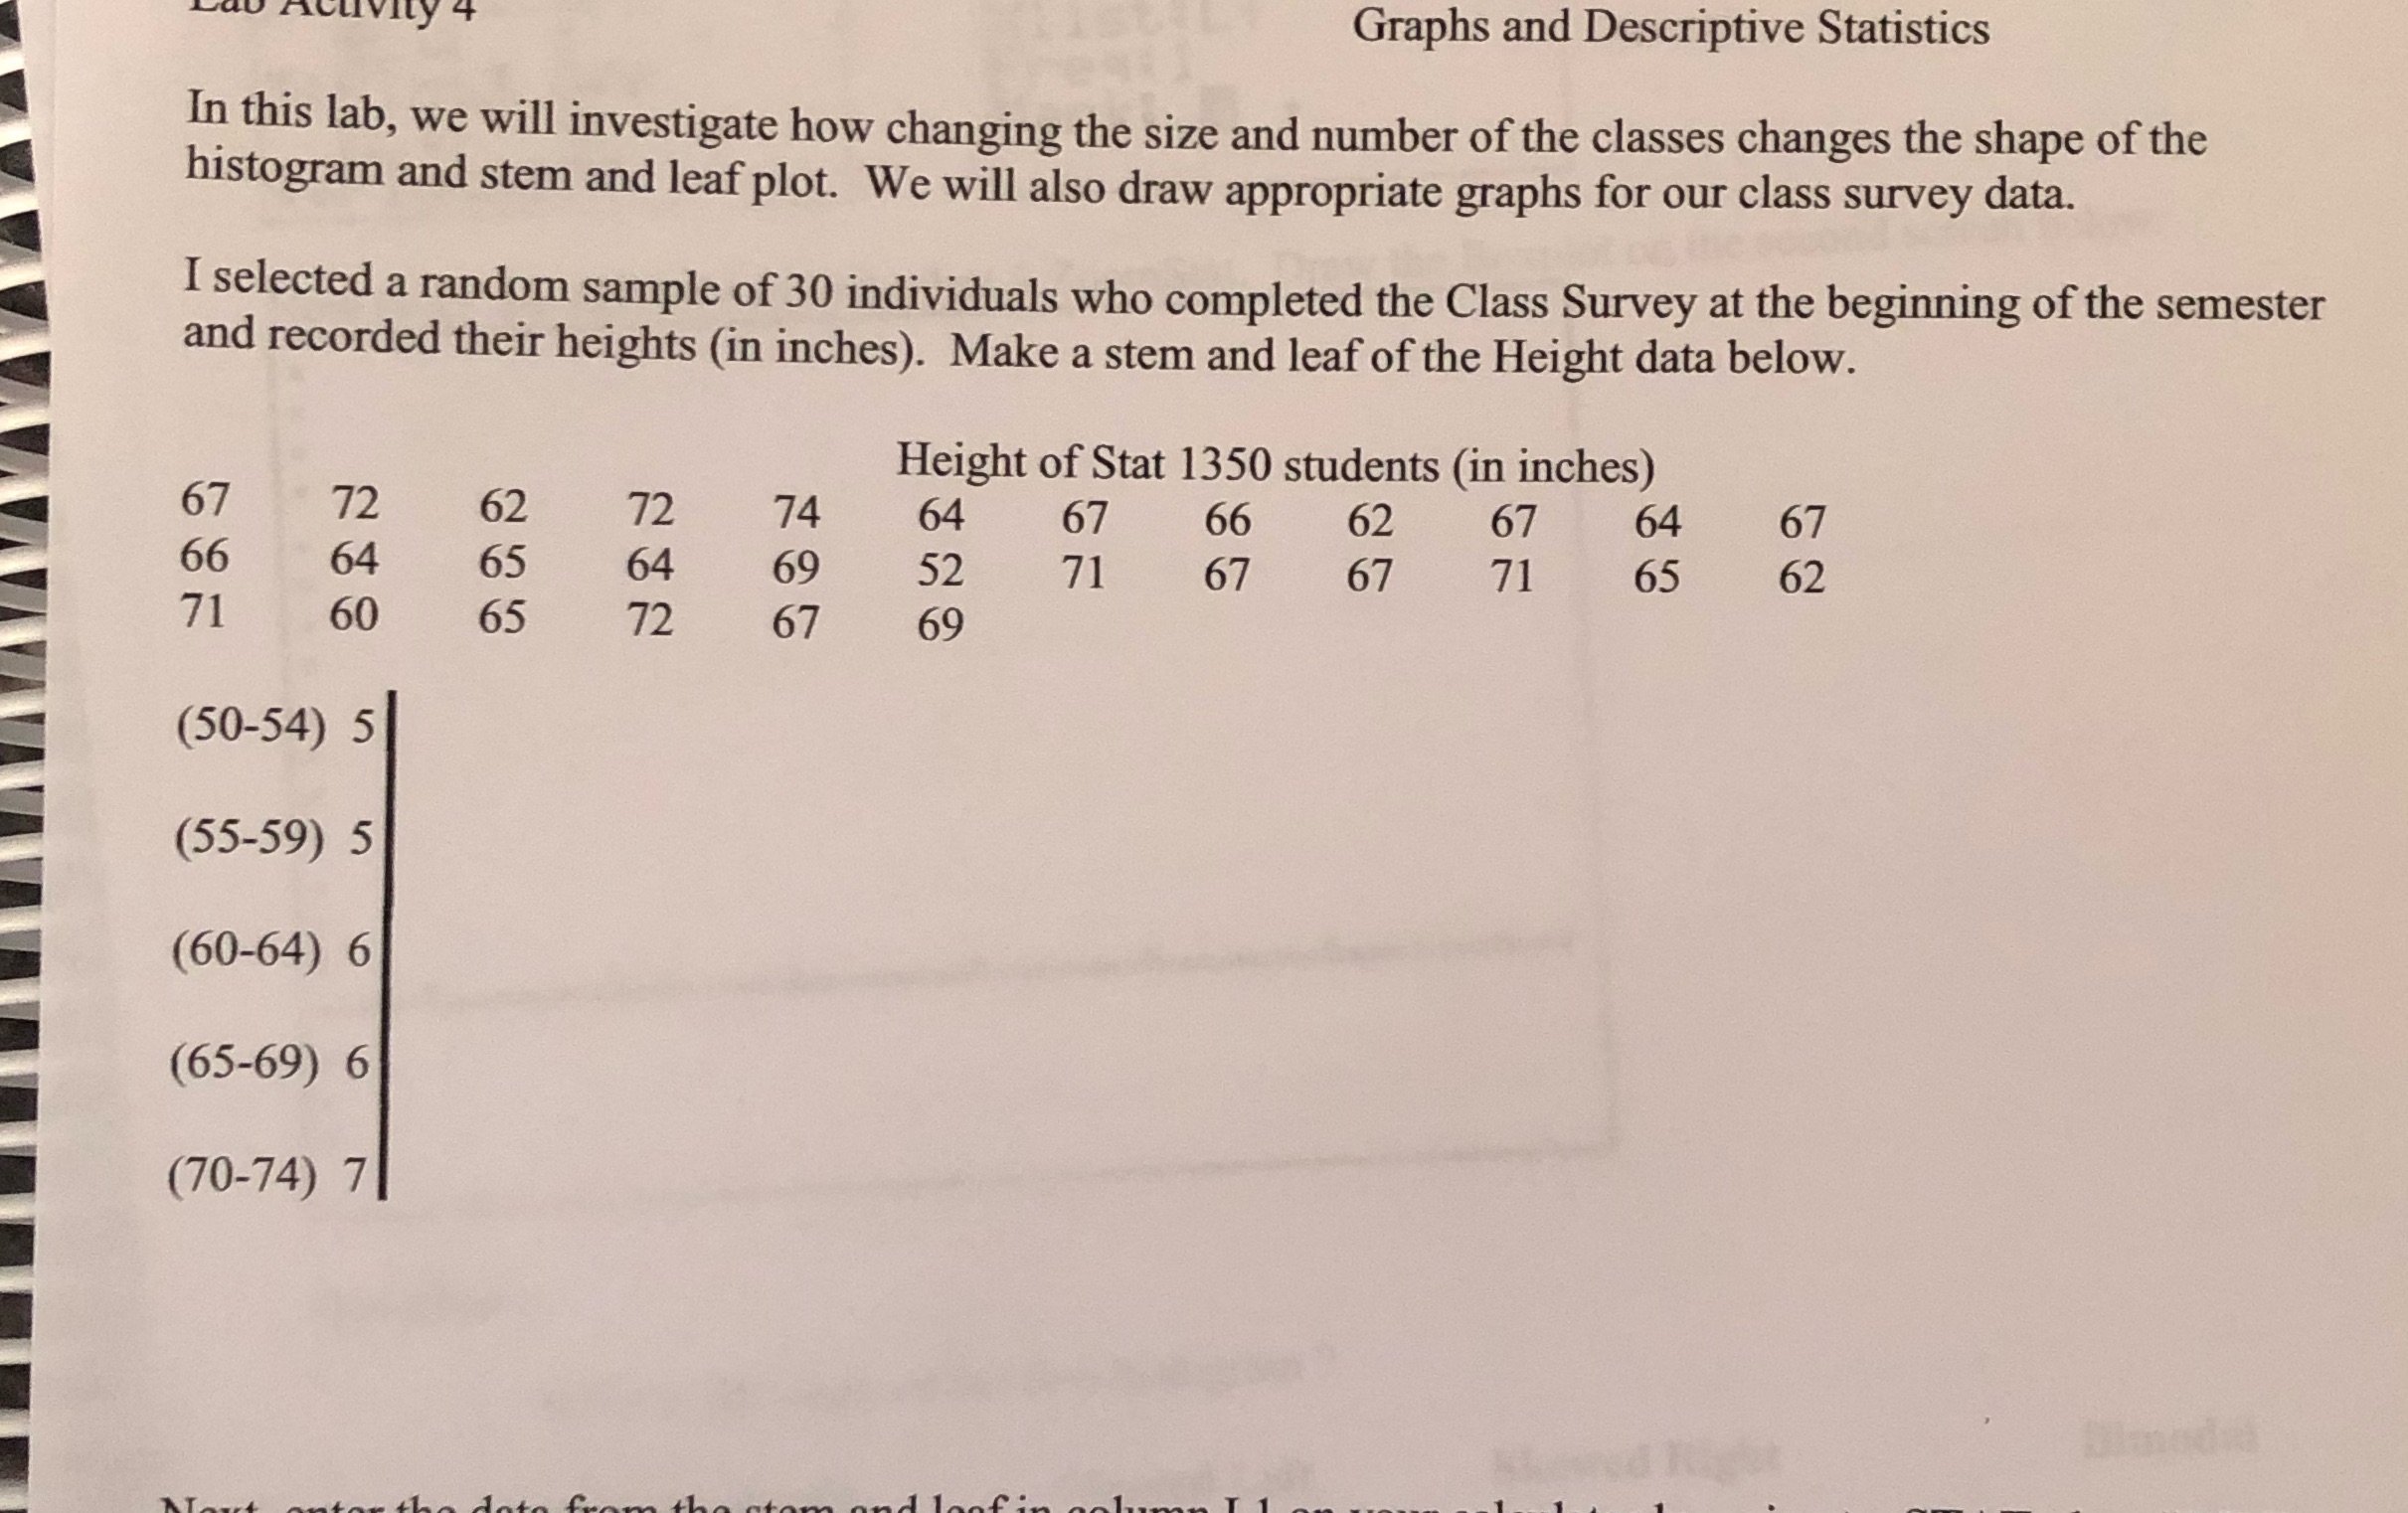
Graphs and Descriptive Statistics In this lab, we will investigate how changing the size and number of the classes changes the shape of the histogram and stem and leaf plot. We will also draw appropriate graphs for our class survey data. I selected a random sample of 30 individuals who completed the Class Survey at the beginning of the semester and recorded their heights (in inches). Make a stem and leaf of the Height data below. Height of Stat 1350 students (in inches) 67 72 62 72 74 64 67 66 62 67 64 67 66 64 65 64 69 52 71 67 67 71 65 62 71 60 65 72 67 69 (50-54) 5 (55-59) 5 (60-64) 6 (65-69) 6 (70-74) 7
Step by Step Solution
There are 3 Steps involved in it
1 Expert Approved Answer
Step: 1 Unlock

Question Has Been Solved by an Expert!
Get step-by-step solutions from verified subject matter experts
Step: 2 Unlock
Step: 3 Unlock