

Question: Graphs for this assignment must be properly constructed and created using Excel. Prepare your assignment as a Word document with embedded Excel charts begin{tabular}{|l|l|} hline
Graphs for this assignment must be properly constructed and created using Excel. Prepare your assignment as a Word document with embedded Excel charts
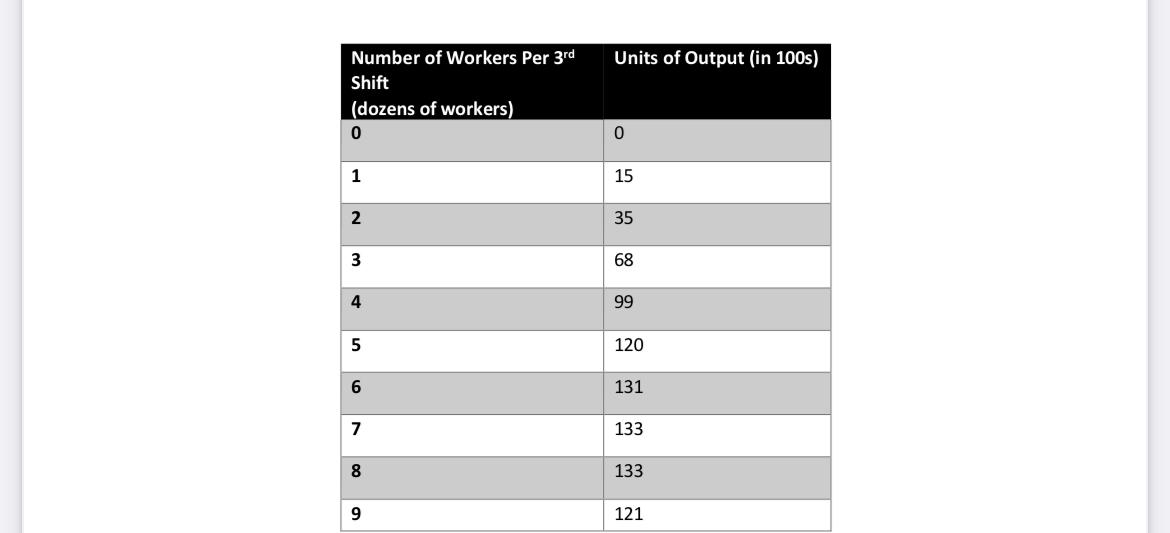
\begin{tabular}{|l|l|} \hline Number of Workers Per 3rd Shift (dozens of workers) & Units of Output (in 100s) \\ \hline 0 & 0 \\ \hline 1 & 15 \\ \hline 2 & 35 \\ \hline 3 & 68 \\ \hline 4 & 99 \\ \hline 5 & 120 \\ \hline 6 & 131 \\ \hline 7 & 133 \\ \hline 8 & 133 \\ \hline 9 & \\ \hline \end{tabular} \begin{tabular}{|l|l|} \hline Number of Workers Per 3rd Shift (dozens of workers) & Units of Output (in 100s) \\ \hline 0 & 0 \\ \hline 1 & 15 \\ \hline 2 & 35 \\ \hline 3 & 68 \\ \hline 4 & 99 \\ \hline 5 & 120 \\ \hline 6 & 131 \\ \hline 7 & 133 \\ \hline 8 & 133 \\ \hline 9 & \\ \hline \end{tabular}
Step by Step Solution
There are 3 Steps involved in it

Get step-by-step solutions from verified subject matter experts