

Question: Grey boxes need answers, white boxes do not. Drop down Menu options for all arrow boxes Identifying and Analyzing Financial Statement Effects of Stock Transactions
Grey boxes need answers, white boxes do not.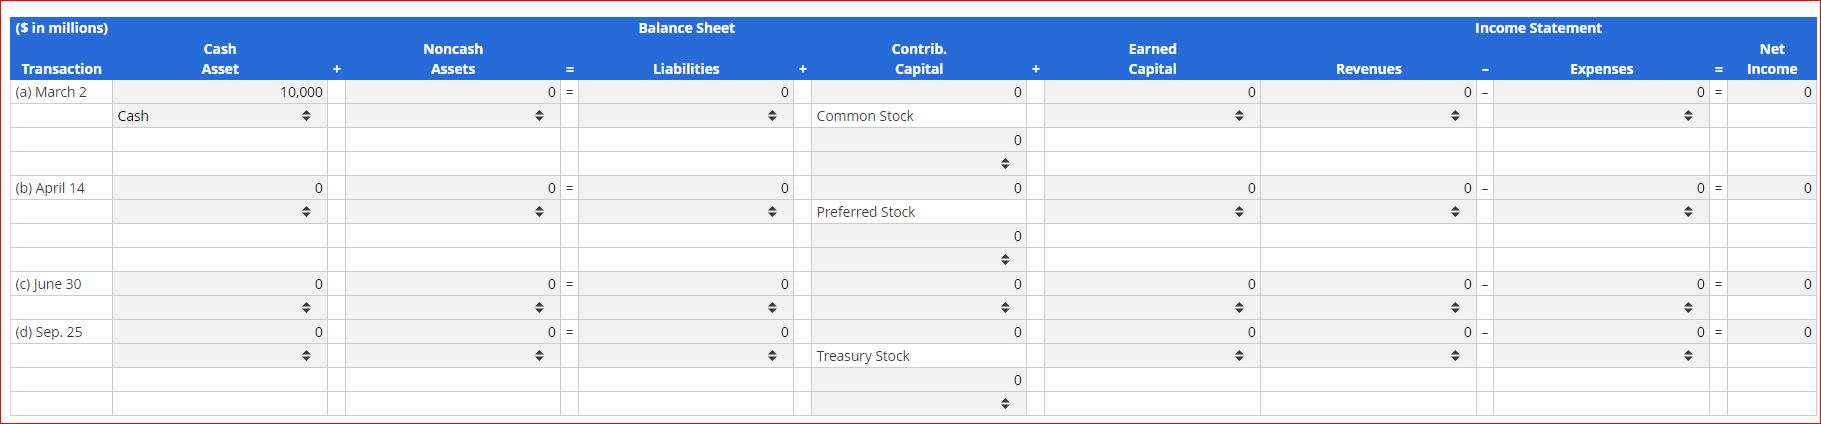
Drop down Menu options for all arrow boxes
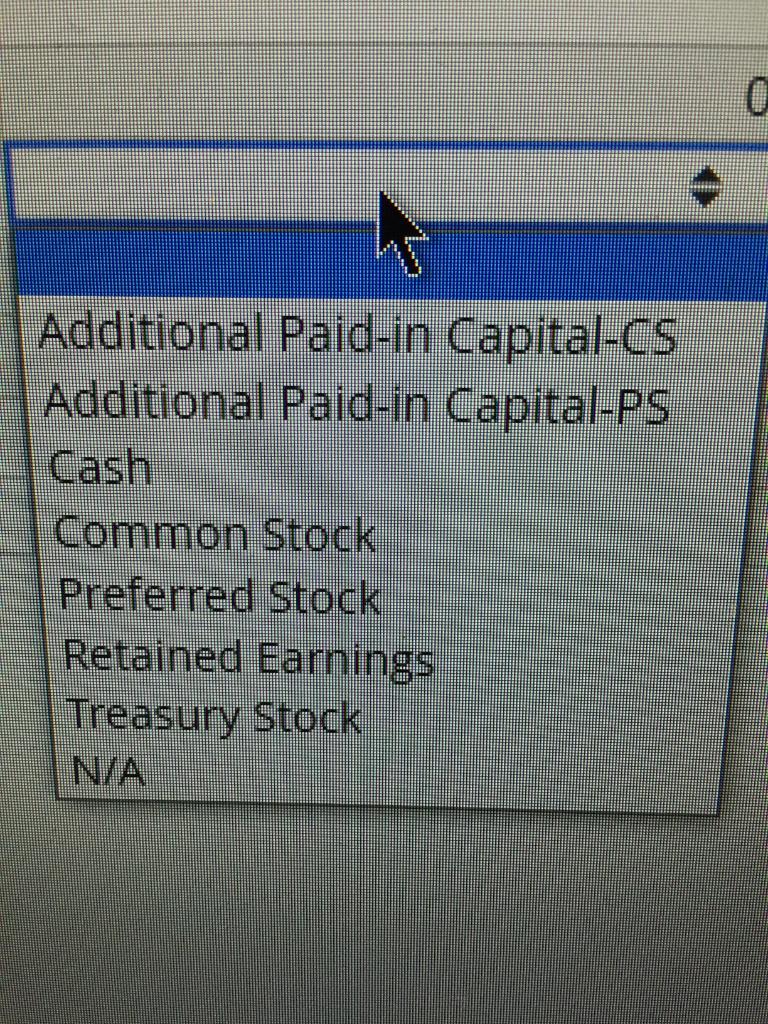
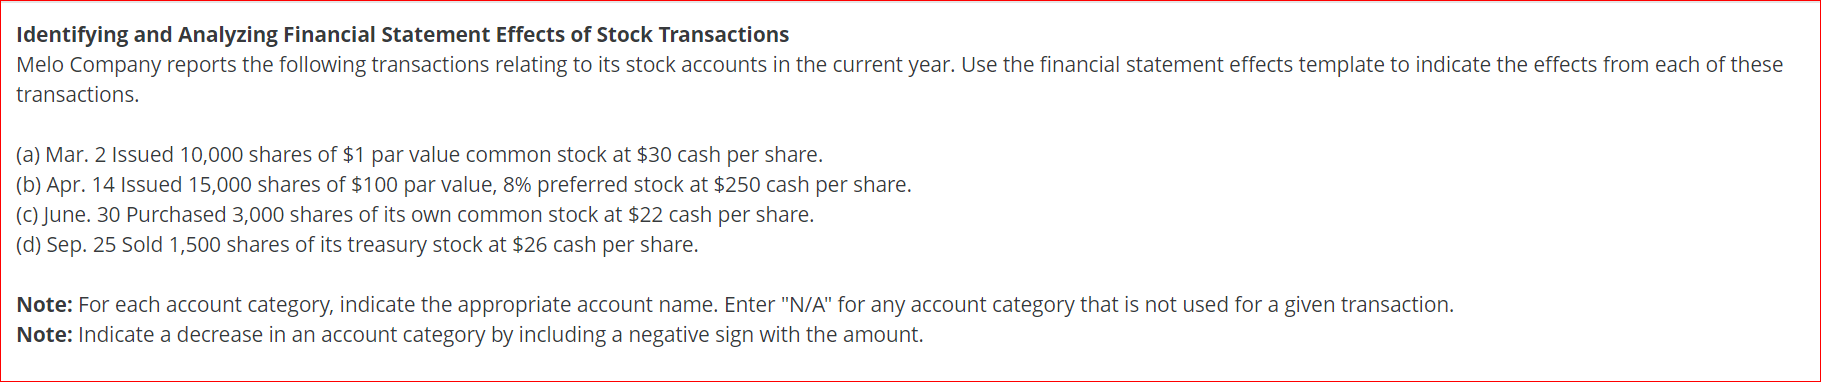
Identifying and Analyzing Financial Statement Effects of Stock Transactions Melo Company reports the following transactions relating to its stock accounts in the current year. Use the financial statement effects template to indicate the effects from each of these transactions. (a) Mar. 2 Issued 10,000 shares of $1 par value common stock at $30 cash per share. (b) Apr. 14 Issued 15,000 shares of $100 par value, 8% preferred stock at $250 cash per share. (C) June. 30 Purchased 3,000 shares of its own common stock at $22 cash per share. (d) Sep. 25 Sold 1,500 shares of its treasury stock at $26 cash per share. Note: For each account category, indicate the appropriate account name. Enter "N/A" for any account category that is not used for a given transaction. Note: Indicate a decrease in an account category by including a negative sign with the amount. ($ in millions) Balance Sheet Income Statement Cash Asset Noncash Assets Contrib. Capital Earned Capital Liabilities Revenues Expenses Transaction (a) March 2 Net Income 0 10,000 0 = 0 0 0 0 0 0 = Cash Common Stock a 0 (b) April 14 0 0 = 0 0 0 0 0 0 = 0 Preferred Stock 0 (C) June 30 0 0 = 0 0 0 0 0 = 0 e (d) Sep. 25 0 0 = 0 0 0 0 0 = 0 Treasury Stock 0 a Additional Paid-in Capital-CS Additional Paid-in Capital-PS Cash Common Stock Preferred Stock Retained Earnings Treasury Stock N/A
Step by Step Solution
There are 3 Steps involved in it

Get step-by-step solutions from verified subject matter experts