

Question: Gridlines Headings Normal Page Break Page Custom Preview Layout Views Workbook Views Zoom 100% Zoom to Selection Window Macros Show Zoom Macros fa AB D
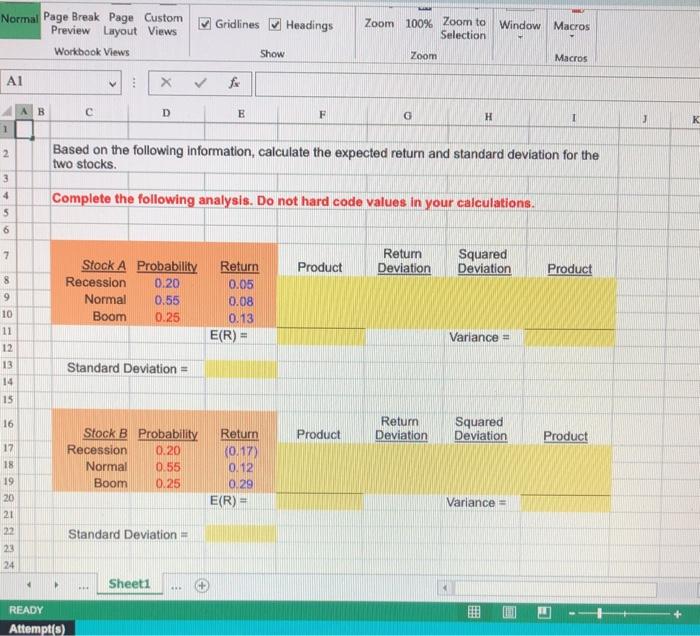
Gridlines Headings Normal Page Break Page Custom Preview Layout Views Workbook Views Zoom 100% Zoom to Selection Window Macros Show Zoom Macros fa AB D E F H 1 J K 1 N- Based on the following information, calculate the expected return and standard deviation for the two stocks. 3 4 Complete the following analysis. Do not hard code values in your calculations. 5 6 7 Product Return Deviation Squared Deviation Product 8 Stock A Probability Recession 0.20 Normal 0.55 Boom 0.25 9 Return 0.05 0.08 0.13 E(R) = 10 11 Variance 12 13 Standard Deviation = 14 15 16 Product Return Deviation Squared Deviation Product 17 18 19 Stock B Probability Recession 0.20 Normal 0.55 Boom 0.25 Return (0.17) 0.12 0.29 E(R) = Variance = 20 21 22 23 24 Standard Deviation = Sheet1 + READY Attempt(s)
Step by Step Solution
There are 3 Steps involved in it

Get step-by-step solutions from verified subject matter experts