Question: Gross Margin Products and Services gross margin and gross margin percentage for 2024, 2023 and 2022 were as follows (dollars in millions): Gross margin: Products
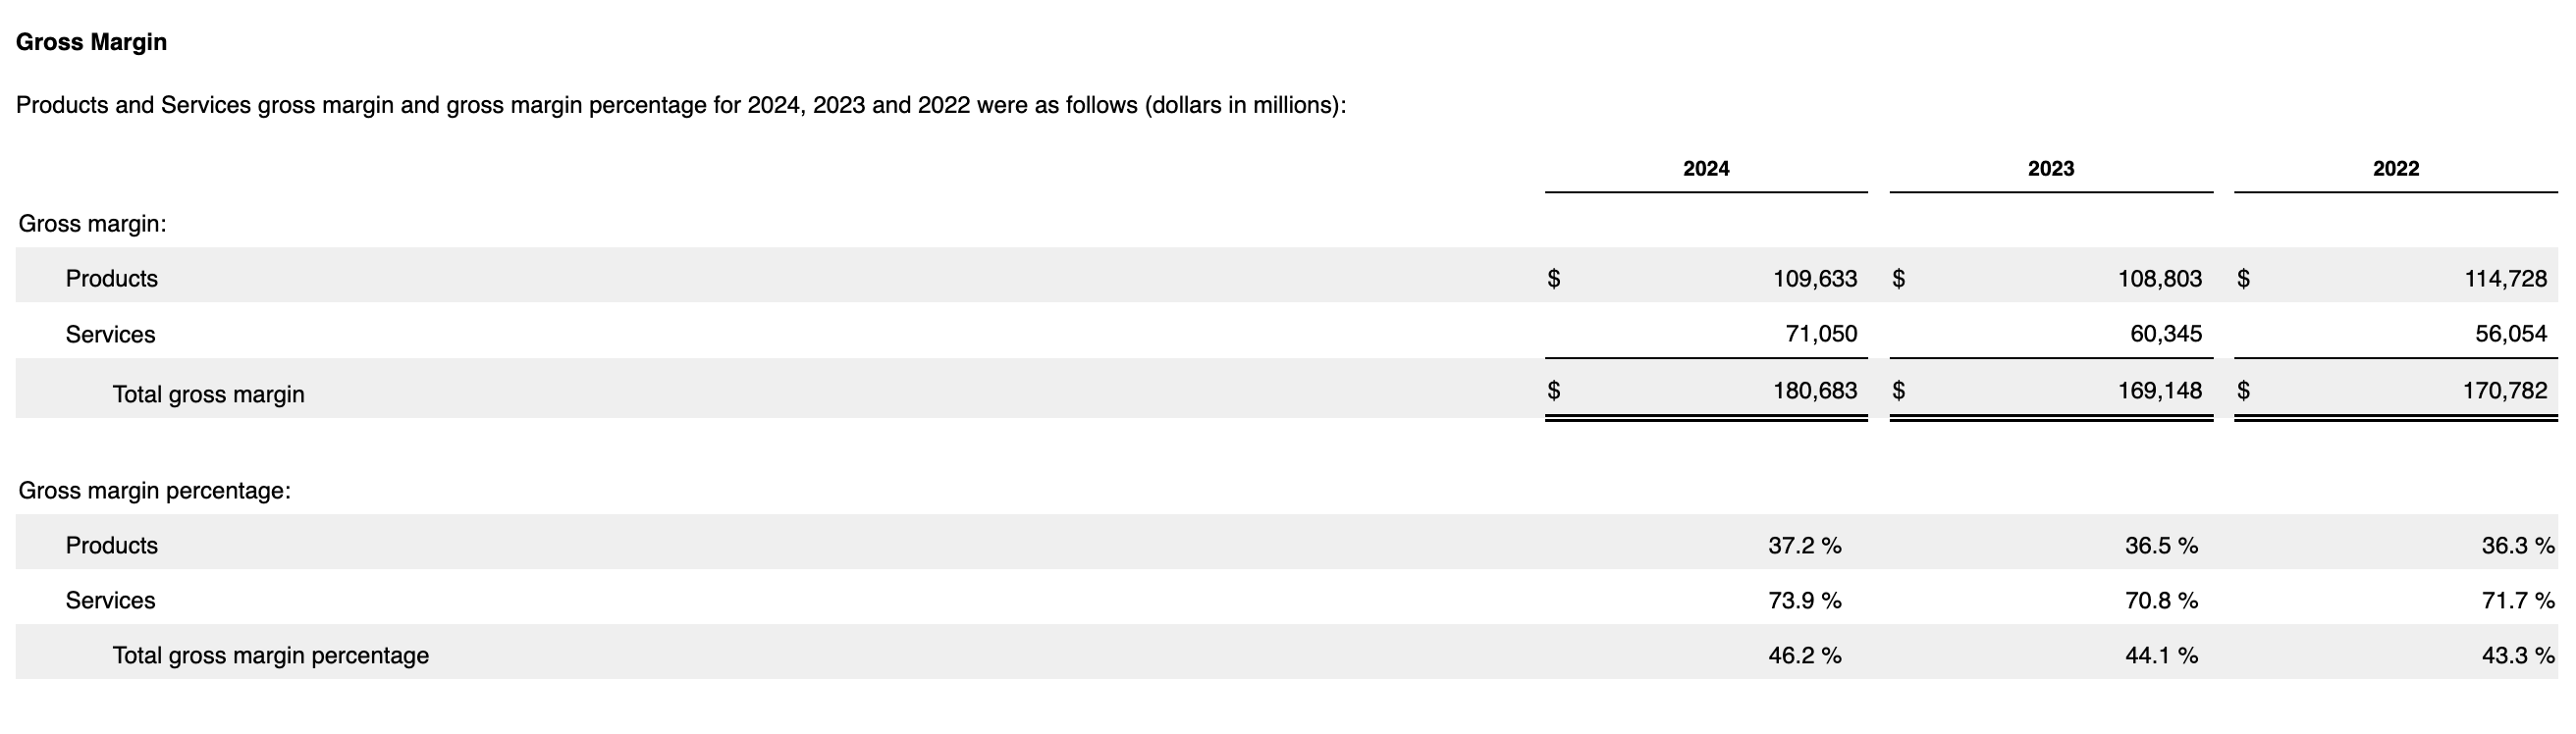
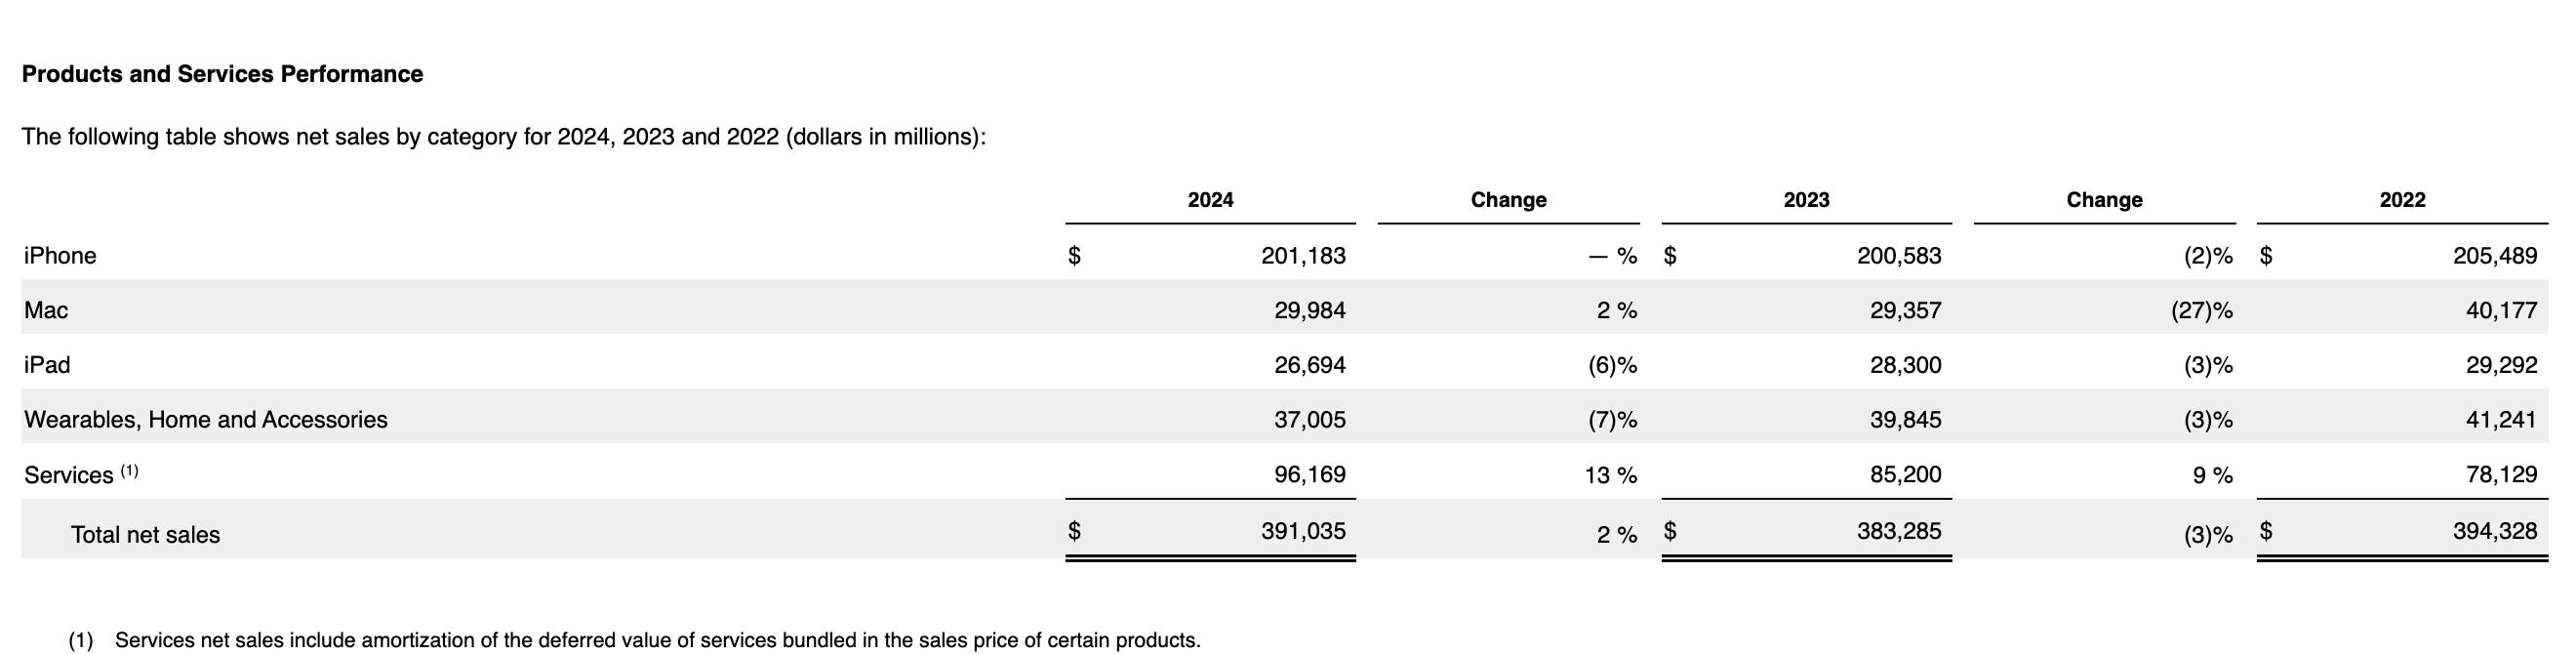
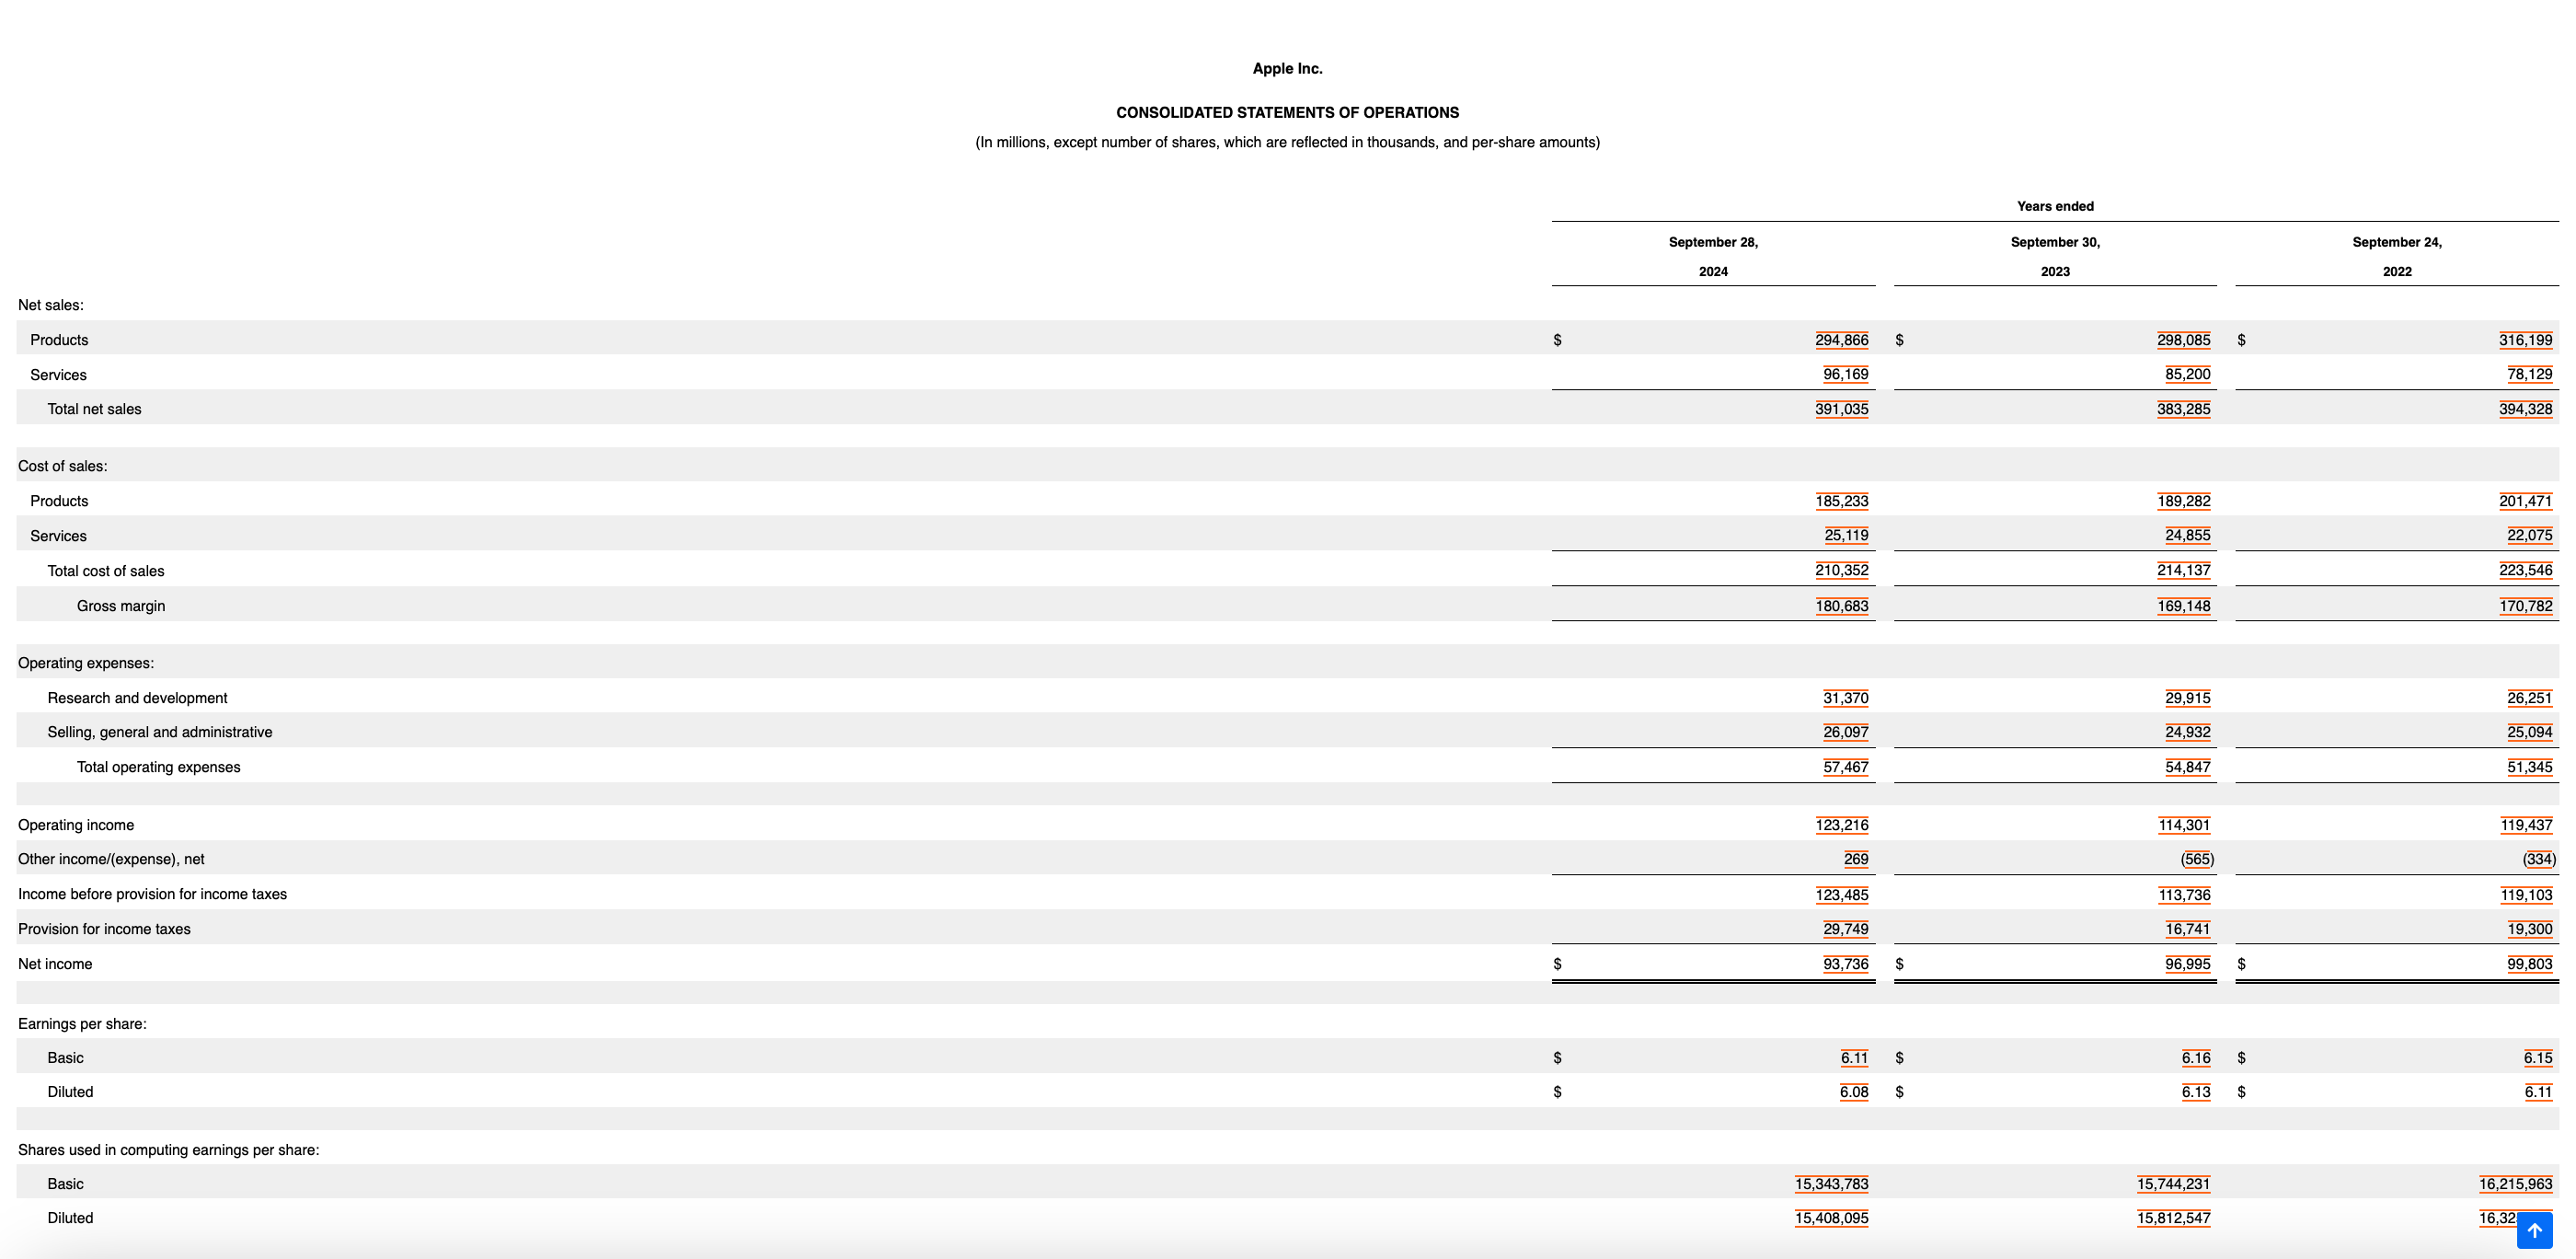
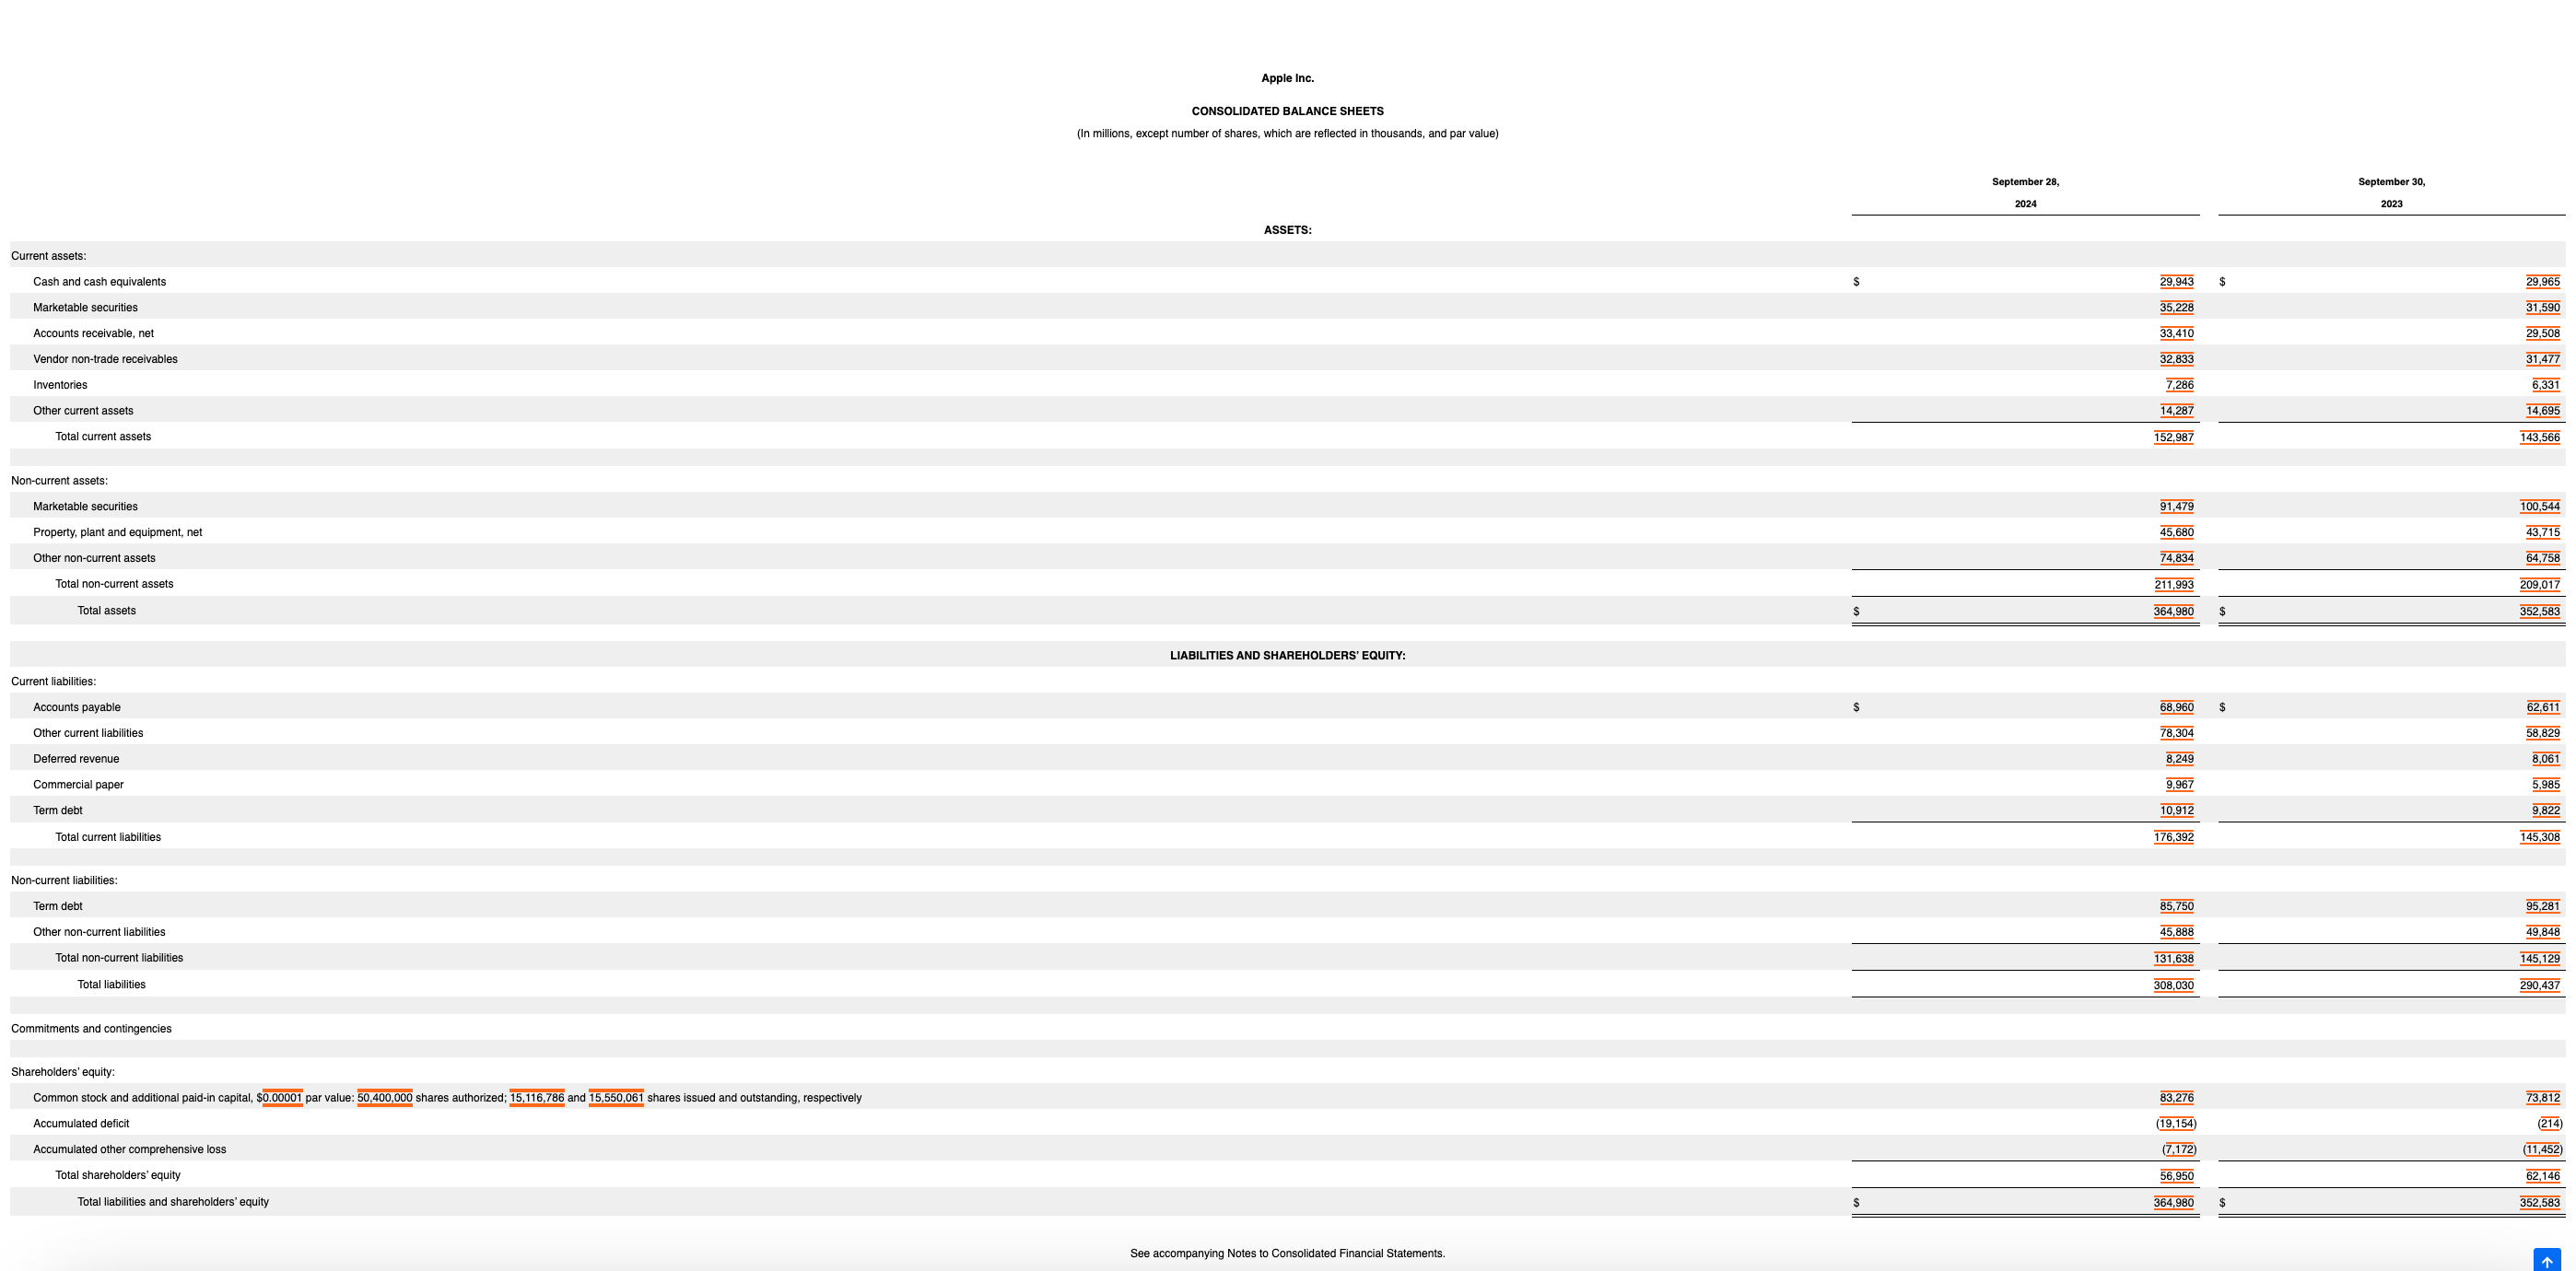
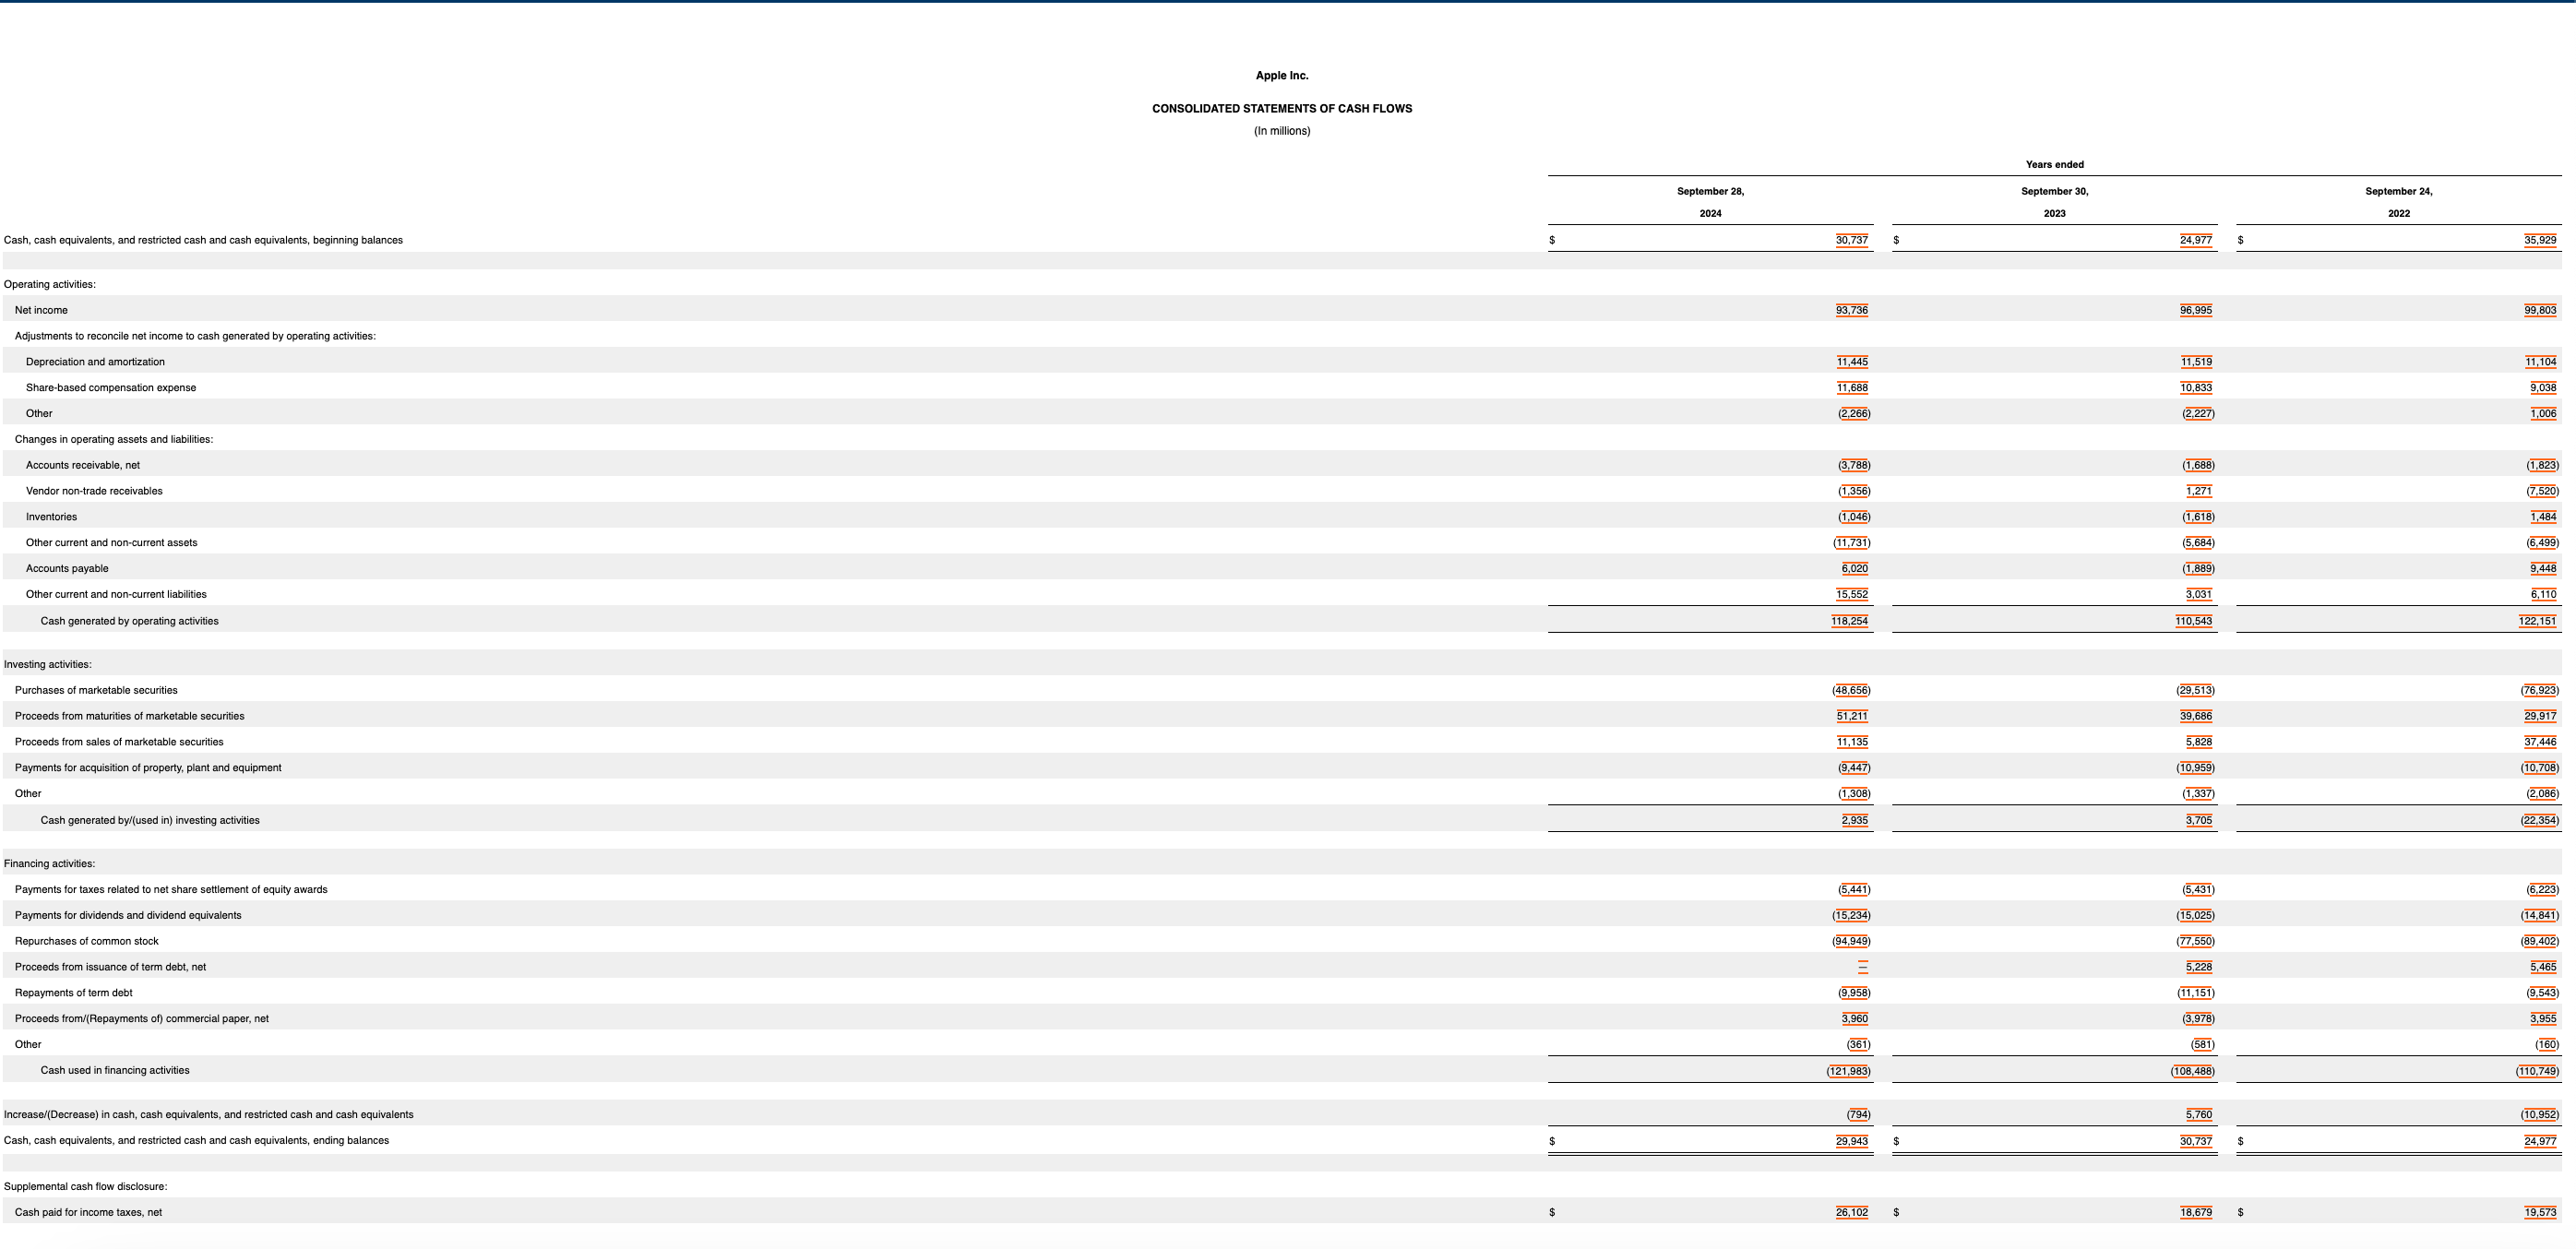
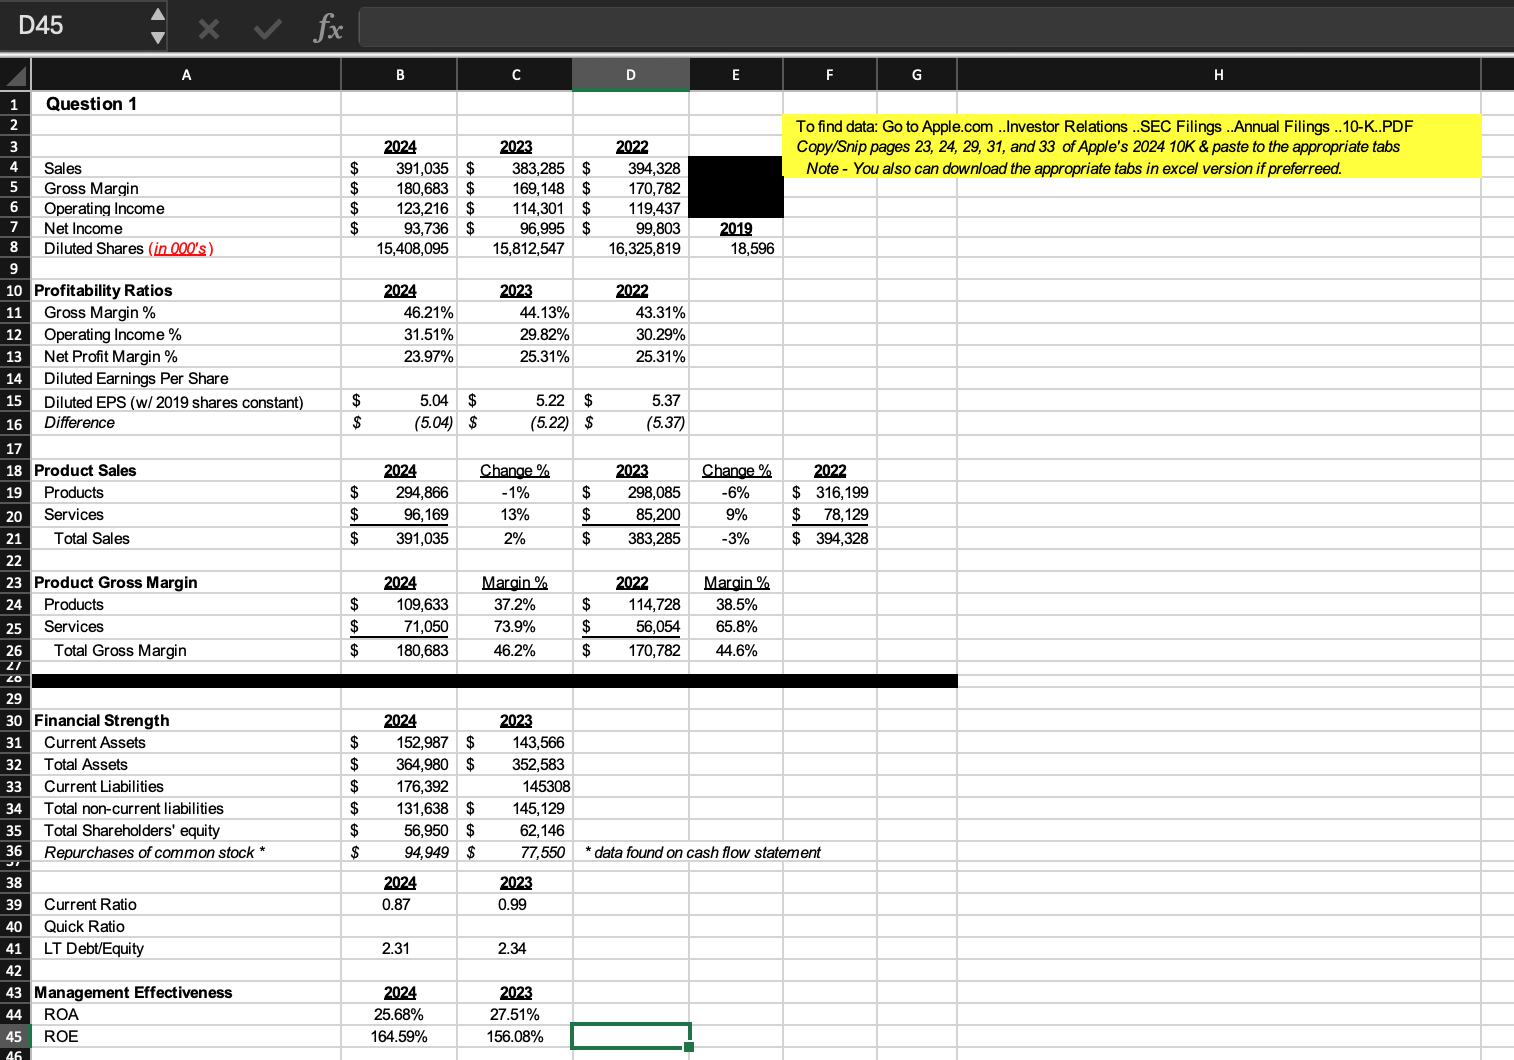
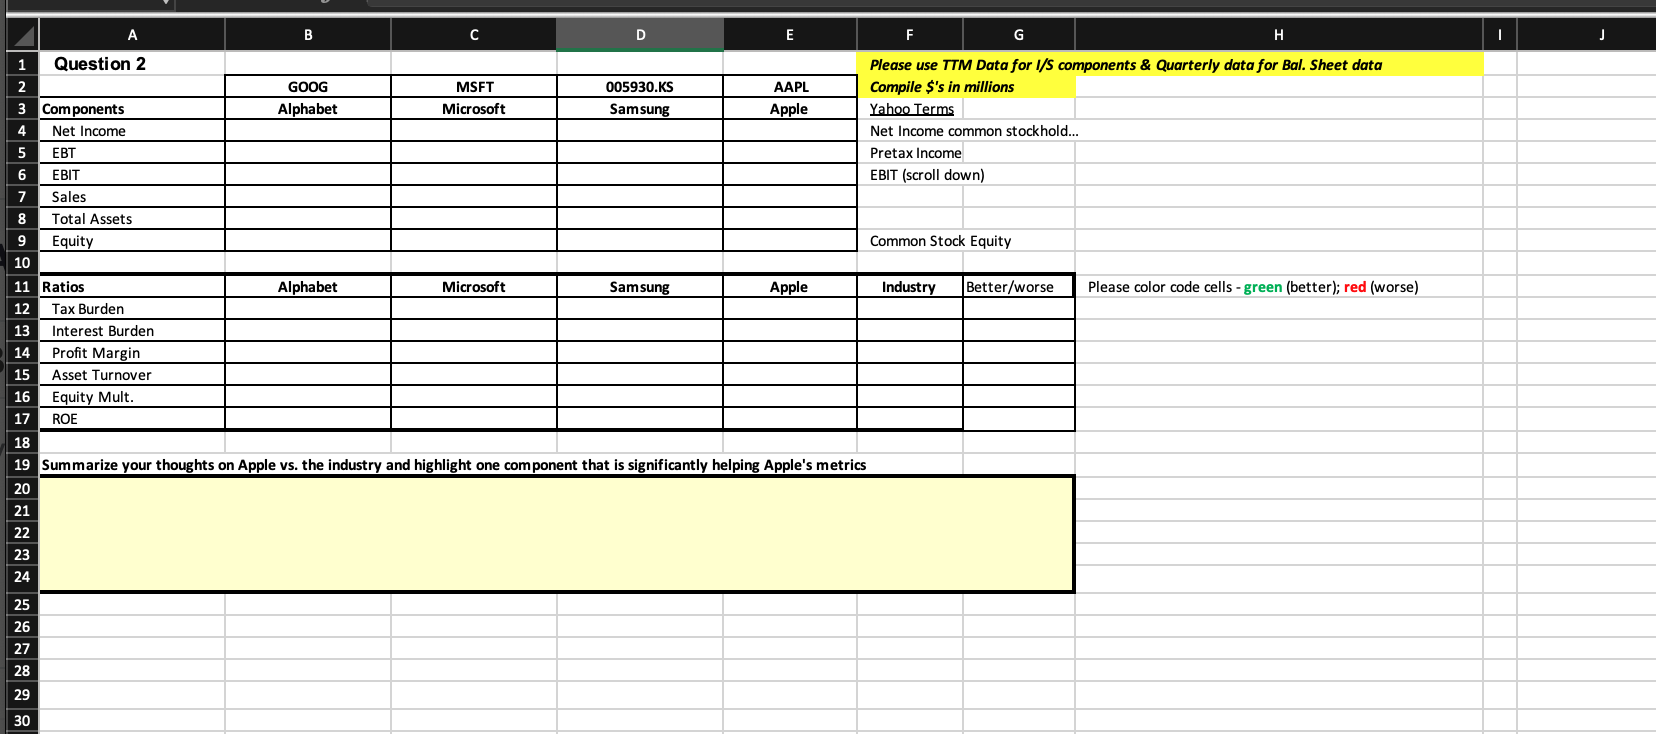
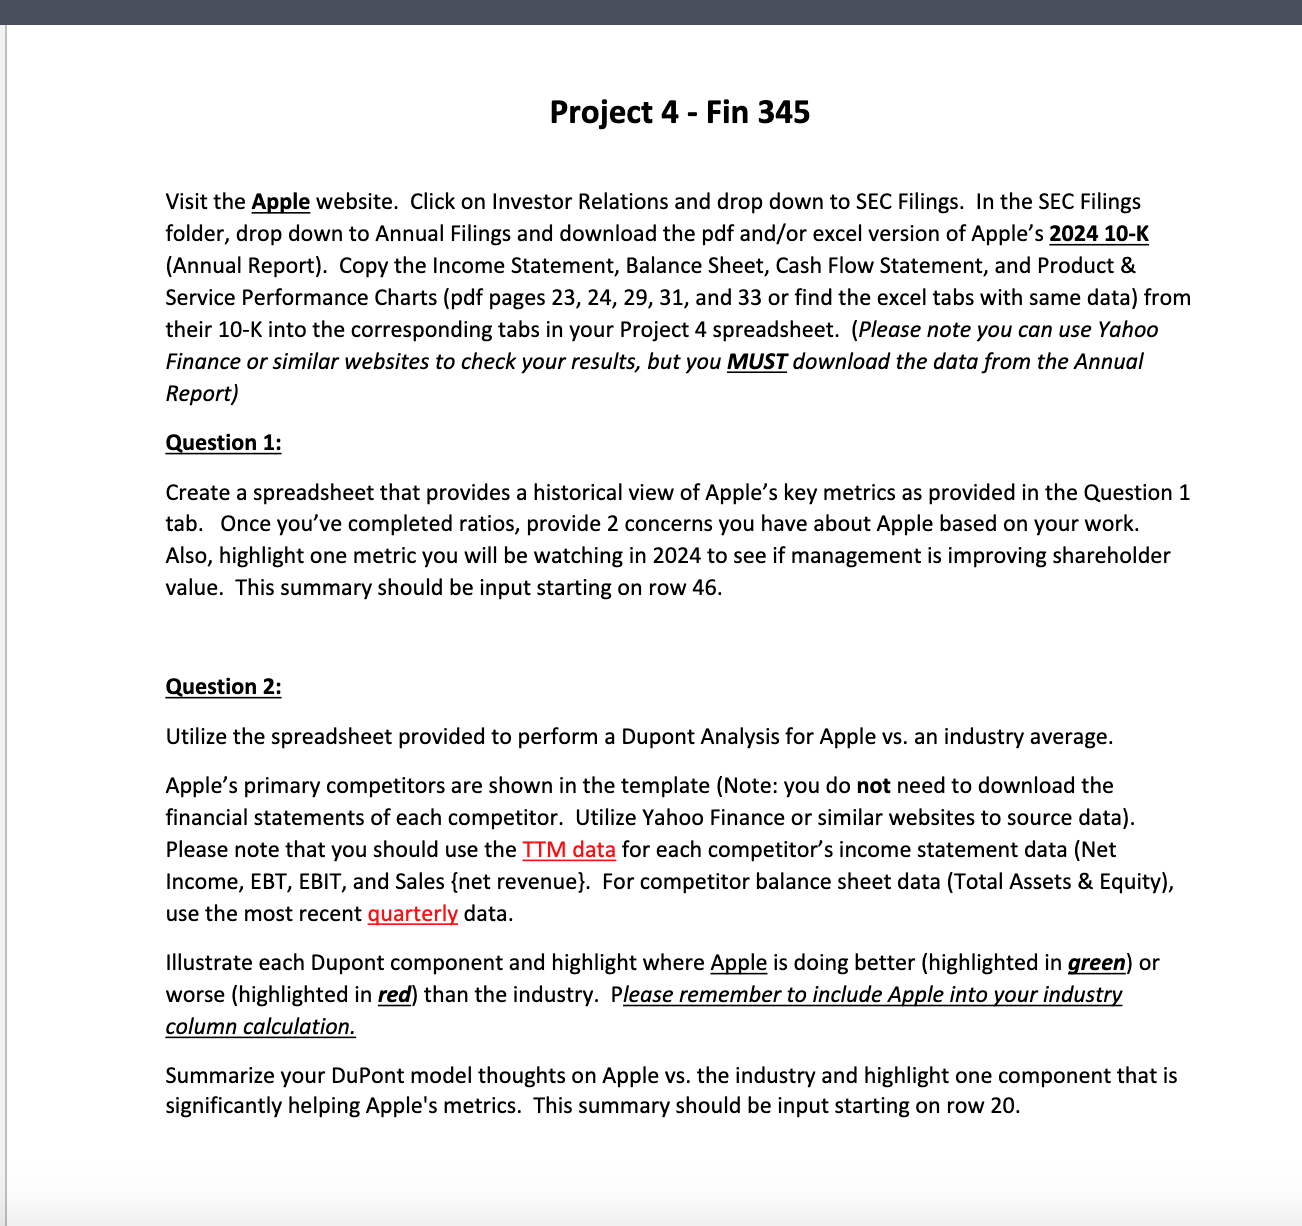
Gross Margin Products and Services gross margin and gross margin percentage for 2024, 2023 and 2022 were as follows (dollars in millions): Gross margin: Products Services Total gross margin Gross margin percentage: Products Services Total gross margin percentage 2024 2023 2022 109,633 $ 108,803 $ 114,728 71,050 60,345 56,054 180,683 $ 169,148 $ 170,782 37.2% 36.5 % 36.3 % 73.9 % 70.8 % 71.7% 46.2 % 44.1% 43.3% Products and Services Performance The following table shows net sales by category for 2024, 2023 and 2022 (dollars in millions): Change 2023 Change 2022 2024 iPhone $ 201,183 Mac 29,984 iPad 26,694 Wearables, Home and Accessories 37,005 Services \") 96,169 Total net sales $ 391,035 (1) Services net sales include amortization of the deferred value of services bundled in the sales price of certain products. % 2% (6)% (7)% 13% 2% 200,583 29,357 28,300 39,845 85,200 383,285 (2)% (27)% (3)% (3)% 9% (3)% 205,489 40,177 29,292 41,241 78,129 394,328 Net sales: Products Services Total net sales Cost of sales: Products Services Total cost of sales Gross margin Operating expenses: Research and development Selling, general and administrative Total operating expenses Operating income Other income/(expense), net Income before provision for income taxes Provision for income taxes Net income Earnings per share: Basic Diluted Shares used in computing earnings per share: Basic Diluted Apple Inc. CONSOLIDATED STATEMENTS OF OPERATIONS (in millions, except number of shares, which are reflected in thousands, and per-share amounts) Years ended 'September 28, 'September 30, 'September 24, 2028 2023 2022 Apple Inc. CONSOLIDATED BALANCE SHEETS (In millions, except number of shares, which are reflected in thousands, and par value) September 28, September 30, 2024 202 ASSETS: Current assets: Cash and cash equivalents 29,943 29.965 Marketable securities 35,228 31.590 Accounts receivable, net 33,410 29,508 Vendor non-trade receivables 32,833 31.477 Inventories 7,286 6,331 Other current assets 14,287 14.695 Total current assets 152,987 143.566 Non-current assets: Marketable securities 91.479 100,54 Property, plant and equipment, net 45,680 13,715 Other non-current assets 74,834 54,758 Total non-current assets 211,993 209,017 Total assets 364,980 352,583 LIABILITIES AND SHAREHOLDERS' EQUITY: Current liabilities: Accounts payable 58,960 62,617 Other current liabilities 78,304 58,829 Deferred revenue 8,249 8,061 Commercial paper 9,967 5.985 Term debt 10.912 9,822 Total current liabilities 176,392 45,30 Non-current liabilities Term debt 85,750 95,281 Other non-current liabilities 45,88 49,848 Total non-current liabilities 131,638 145,129 Total liabilities 308,030 290.43 commitments and contingencies Shareholders' equity: Common stock and additional paid-in capital, $0.00001 par value: 50.400,000 shares authorized; 15.116,786 and 15.550,061 shares issued and outstanding, respectively 83,276 73,812 Accumulated deficit 19.154) (214 Accumulated other comprehensive loss (7.172 (11,452) Total shareholders' equity 56,950 62,146 Total liabilities and shareholders' equity 364,980 352,583 See accompanying Notes to Consolidated Financial Statements.Apple Inc. CONSOLIDATED STATEMENTS OF CASH FLOWS (In millions) Years ended September 28, September 30, September 24, 2024 2023 2022 Cash, cash equivalents, and restricted cash and cash equivalents, beginning balances 30,737 24,977 35,929 Operating activities: Net income 93,736 96,995 99,803 Adjustments to reconcile net income to cash generated by operating activities: Depreciation and amortization 11.445 11,519 11,104 Share-based compensation expense 11.688 10,833 9.038 Other (2.266) 2,227) 1,006 Changes in operating assets and liabilities: Accounts receivable, net (3.788) (1,688) (1,823) Vendor non-trade receivables (1,356) 1.271 (7,520) nventories (1.046) 1.618) 1.484 Other current and non-current assets 11,731 (5,684) (6,499) Accounts payable 8,020 (1,889) 9,448 Other current and non-current liabilities 15.552 3,031 5.110 Cash generated by operating activities 118.254 110,543 122.151 Investing activities: Purchases of marketable securities (48.656) (29.513) (76.923) Proceeds from maturities of marketable securities 51.211 39.686 29,917 Proceeds from sales of ma rketable securities 11.135 5.828 37,446 Payments for acquisition of property, plant and equipment (9,447) (10,959) 10,708 Other (1,308) 1,337) 2,086) Cash generated by/(used in) investing activities 2.935 3,705 22,354) Financing activities: Payments for taxes related to net sha lement of equity awards (5.441) (5,431) 6,223) Payments for dividends and dividend equivalents (15,234 ) (15,025) 14,841) Repurchases of common stock (94.949) (77.550) (89,402) Proceeds from issuance of term debt, net E 5,228 5,465 Repayments of term debt (9.958) 11.151 (9,543) Proceeds from/(Repayments of) commercial paper, net 3.960 (3,978) 3,955 Other 361) 581 (160) Cash used in financing activities (121,983) 108,488) 110,749 Increase/(Decrease) in cash, cash equivalents, and restricted cash and cash equivalents 794) 5.760 10,952) Cash, cash equivalents, and restricted cash and cash equivalents, ending balances S+6'6 30,737 24,977 Supplemental cash flow disclosure: Cash paid for income taxes, net 26.102 18.679 19,573Question 1 Sales Gross Margin Operating Income Net Income Diluted Shares (in 000's) Profitability Ratios Gross Margin % Operating Income % Net Profit Margin % Diluted Earnings Per Share Diluted EPS (w/ 2019 shares constant) Difference Product Sales Products Services Total Sales Product Gross Margin Products Services Total Gross Margin Financial Strength Current Assets Total Assets Current Liabilities Total non-current liabilities Total Shareholders' equity Repurchases of common stock * Current Ratio Quick Ratio LT Debt/Equity Management Effectiveness ROA ROE tA A nm Ale we wnrwwm ww 2024 391,035 180,683 123,216 93,736 15,408,095 2024 46.21% 31.51% 23.97% 5.04 (5.04) 2024 294,866 96,169 391,035 2024 109,633 71,050 180,683 2024 152,987 364,980 176,392 131,638 56,950 94,949 2024 0.87 2.31 2024 25.68% 164.59% At $ $ ae nn 2023 383,285 169,148 114,301 96,995 15,812,547 2023 44.13% 29.82% 25.31% 5.22 (5.22) Change % -1% 13% 2% 37.2% 73.9% 46.2% 2023 143,566 352,583 145308 145,129 62,146 77,550 2023 0.99 2.34 2023 27.51% 156.08% To find data: Go to Apple.com ..Investor Relations ..SEC Filings ..Annual Filings ..10-K..PDF 2022 Copy/Snip pages 23, 24, 29, 31, and 33 of Apple's 2024 10K & paste to the appropriate tabs $ 394,328 | Note - You also can download the appropriate tabs in excel version if preferreed. $ 170,782 $ 119,437 $ 99,803 2019 16,325,819 18,596 2022 43.31% 30.29% 25.31% $ 5.37 $ (5.37) 2023 Change % 2022 $ 298,085 -6% $ 316,199 $ 85,200 9% $78,129 $ 383,285 -3% $ 394,328 2022 Margin % $ 114,728 38.5% $ 56,054 65.8% $ 170,782 44.6% * data found on cash flow statement or ea ene a nen G Question 2 Compile $'s in millions Yahoo Terms Net Income Net Income common stockhold... EBT Pretax Income EBIT (scroll down) Total Assets Equity Common Stock Equity Alphabet Apple Industry Interest Burden Profit Margin PT Asset Turnover Equity Mult. ROE Summarize your thoughts on Apple vs. the industry and highlight one component that is significantly helping Apple's metrics i Please use TTM Data for I/S components & Quarterly data for Bal. Sheet data Please color code cells - green (better); red (worse) Project 4 - Fin 345 Visit the Apple website. Click on Investor Relations and drop down to SEC Filings. In the SEC Filings folder, drop down to Annual Filings and download the pdf and/or excel version of Apple's 2024 10-K (Annual Report). Copy the Income Statement, Balance Sheet, Cash Flow Statement, and Product & Service Performance Charts (pdf pages 23, 24, 29, 31, and 33 or find the excel tabs with same data) from their 10-K into the corresponding tabs in your Project 4 spreadsheet. (Please note you can use Yahoo Finance or similar websites to check your results, but you MUST download the data from the Annual Report) Question 1: Create a spreadsheet that provides a historical view of Apple's key metrics as provided in the Question 1 tab. Once you've completed ratios, provide 2 concerns you have about Apple based on your work. Also, highlight one metric you will be watching in 2024 to see if management is improving shareholder value. This summary should be input starting on row 46. Question 2: Utilize the spreadsheet provided to perform a Dupont Analysis for Apple vs. an industry average. Apple's primary competitors are shown in the template (Note: you do not need to download the financial statements of each competitor. Utilize Yahoo Finance or similar websites to source data). Please note that you should use the TTM data for each competitor's income statement data (Net Income, EBT, EBIT, and Sales {net revenue}. For competitor balance sheet data (Total Assets & Equity), use the most recent quarterly data. Illustrate each Dupont component and highlight where Apple is doing better (highlighted in green) or worse (highlighted in red) than the industry. Please remember to include Apple into your industry column calculation. Summarize your DuPont model thoughts on Apple vs. the industry and highlight one component that is significantly helping Apple's metrics. This summary should be input starting on row 20
Step by Step Solution
There are 3 Steps involved in it
1 Expert Approved Answer
Step: 1 Unlock
Question Has Been Solved by an Expert!
Get step-by-step solutions from verified subject matter experts
Step: 2 Unlock
Step: 3 Unlock
Students Have Also Explored These Related Finance Questions!