

Question: Group Group Activity 1 Activity - discuss in Recently you were hired as a junior accountant at an international teams consulting company, Clayton Consulting. One

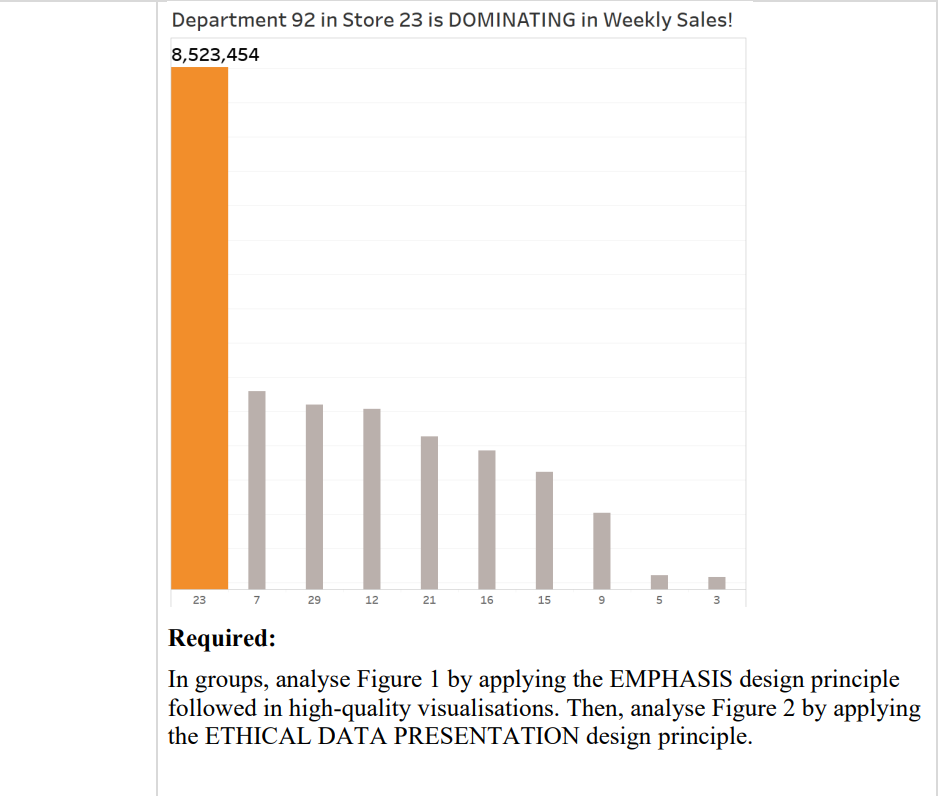
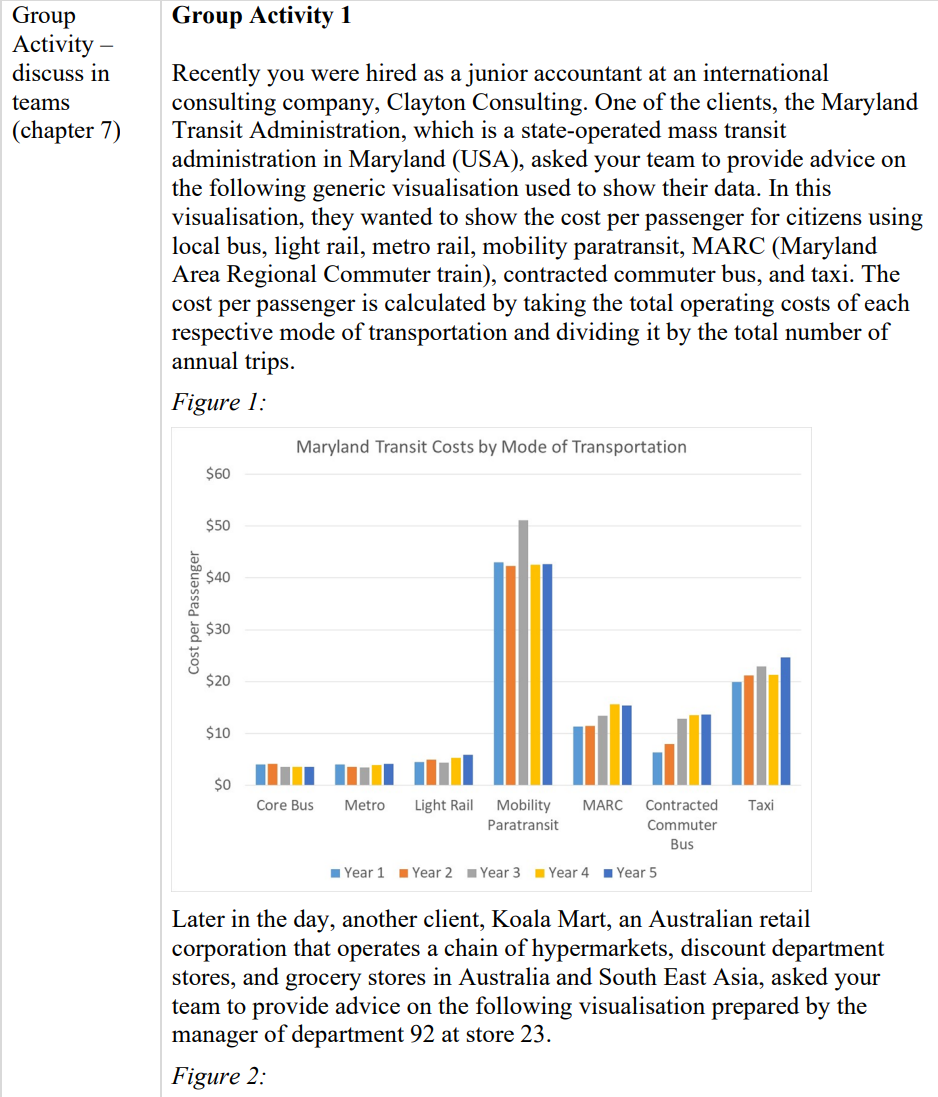

Group Group Activity 1 Activity - discuss in Recently you were hired as a junior accountant at an international teams consulting company, Clayton Consulting. One of the clients, the Maryland (chapter 7) Transit Administration, which is a state-operated mass transit administration in Maryland (USA), asked your team to provide advice on the following generic visualisation used to show their data. In this visualisation, they wanted to show the cost per passenger for citizens using local bus, light rail, metro rail, mobility paratransit, MARC (Maryland Area Regional Commuter train), contracted commuter bus, and taxi. The cost per passenger is calculated by taking the total operating costs of each respective mode of transportation and dividing it by the total number of annual trips. Figure 1: Maryland Transit Costs by Mode of Transportation $60 $50 $40 Cost per Passenger $30 $20 $10 So IIIII III1 1 Core Bus Metro Light Rail Mobility MARC Contracted Taxi Paratransit Commuter Bus Year 1 . Year 2 . Year 3 . Year 4 . Year 5 Later in the day, another client, Koala Mart, an Australian retail corporation that operates a chain of hypermarkets, discount department stores, and grocery stores in Australia and South East Asia, asked your team to provide advice on the following visualisation prepared by the manager of department 92 at store 23. Figure 2:Department 92 in Store 23 is DOMINATING in Weekly Sales! 8,523,454 23 29 12 21 16 15 9 5 3 Required: In groups, analyse Figure 1 by applying the EMPHASIS design principle followed in high-quality visualisations. Then, analyse Figure 2 by applying the ETHICAL DATA PRESENTATION design principle
Step by Step Solution
There are 3 Steps involved in it

Get step-by-step solutions from verified subject matter experts