

Question: Group Project Sales Data Line 1 1 2 3 4 5 55 6 7 902260 10 11 12 13 Month October October November December January
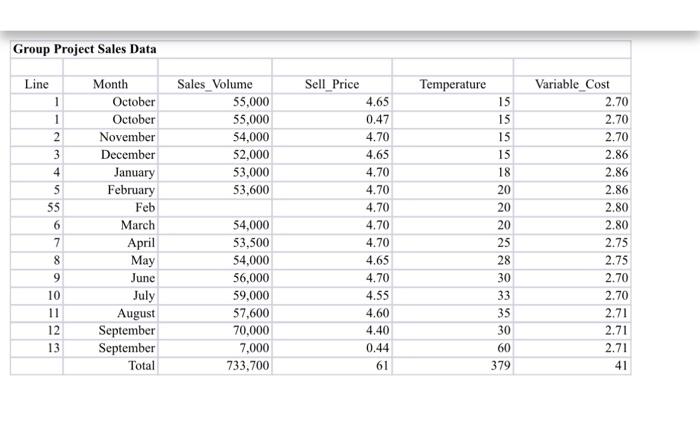
\begin{tabular}{|c|c|c|c|c|c|} \hline \multicolumn{6}{|c|}{ Group Project Sales Data } \\ \hline Line & Month & Sales Volume & Sell Price & Temperature & Variable Cost \\ \hline 1 & October & 55,000 & 4.65 & 15 & 2.70 \\ \hline 1 & October & 55,000 & 0.47 & 15 & 2.70 \\ \hline 2 & November & 54,000 & 4.70 & 15 & 2.70 \\ \hline 3 & December & 52,000 & 4.65 & 15 & 2.86 \\ \hline 4 & January & 53,000 & 4.70 & 18 & 2.86 \\ \hline 5 & February & 53,600 & 4.70 & 20 & 2.86 \\ \hline 55 & Feb & & 4.70 & 20 & 2.80 \\ \hline 6 & March & 54,000 & 4.70 & 20 & 2.80 \\ \hline 7 & April & 53,500 & 4.70 & 25 & 2.75 \\ \hline 8 & May & 54,000 & 4.65 & 28 & 2.75 \\ \hline 9 & June & 56,000 & 4.70 & 30 & 2.70 \\ \hline 10 & July & 59,000 & 4.55 & 33 & 2.70 \\ \hline 11 & August & 57,600 & 4.60 & 35 & 2.71 \\ \hline 12 & September & 70,000 & 4.40 & 30 & 2.71 \\ \hline \multirow[t]{2}{*}{13} & September & 7,000 & 0.44 & 60 & 2.71 \\ \hline & Total & 733,700 & 61 & 379 & 41 \\ \hline \end{tabular}
Step by Step Solution
There are 3 Steps involved in it

Get step-by-step solutions from verified subject matter experts