

Question: Group Statistics Bootstrap BCa 95% Confidence Interval Species Statistic Bias Std. Error Lower Upper Dog-Like Behaviour Dog N 20 Mean 28.0500 .0202 2.3704 23.5990 32.6475
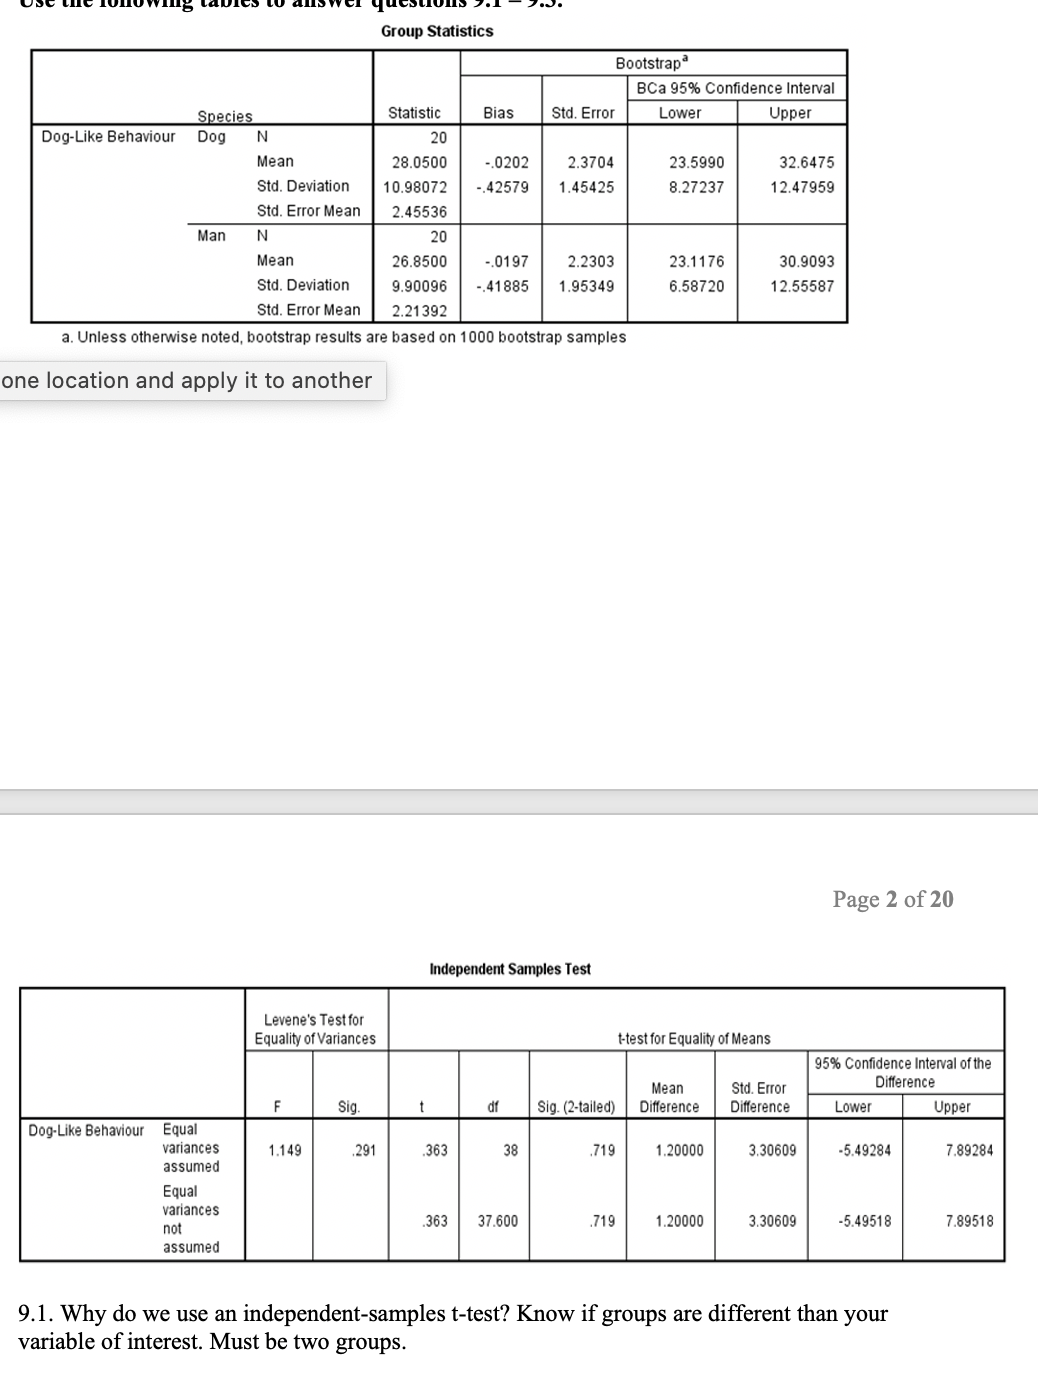
Group Statistics Bootstrap BCa 95% Confidence Interval Species Statistic Bias Std. Error Lower Upper Dog-Like Behaviour Dog N 20 Mean 28.0500 .0202 2.3704 23.5990 32.6475 Std. Deviation 10.98072 -.42579 1.45425 8.27237 12.47959 Std. Error Mean 2.45536 Man N 20 Mean 26.8500 .0197 2.2303 23.1176 30.9093 Std. Deviation 9.90096 -.41885 1.95349 6.58720 12.55587 Std. Error Mean 2.21392 a. Unless otherwise noted, bootstrap results are based on 1000 bootstrap samples one location and apply it to another Page 2 of 20 Independent Samples Test Levene's Test for Equality of Variances t-test for Equality of Means 95% Confidence Interval of the Mean Std. Error Difference Sig. of Sig. (2-tailed) Difference Difference Lower Upper Dog-Like Behaviour Equal variances 1.149 .291 363 38 .719 1.20000 3.30609 -5.49284 7.89284 assumed Equal variances 363 .719 3.30609 not 37.600 1.20000 -5.49518 7.89518 assumed 9.1. Why do we use an independent-samples t-test? Know if groups are different than your variable of interest. Must be two groups
Step by Step Solution
There are 3 Steps involved in it

Get step-by-step solutions from verified subject matter experts