

Question: Group the education variable into two groups: (1) those with less than some college or AA degree and (2) those with some college or AA
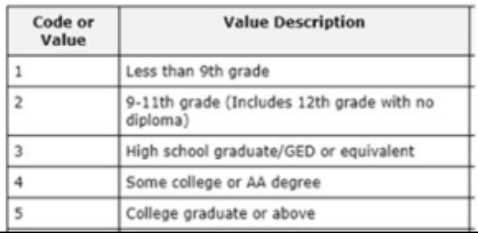
Group the education variable into two groups: (1) those with less than some college or AA degree and (2) those with some college or AA degree and above. (see codes below). Next, also group the systolic blood pressure variable (systbp) into 3 groups: (1) less than 120, (2) 120-140 inclusive, and (3) greater than 140 mmHg. After grouping, conduct an appropriate test to examine if there is an association between the two education and the three blood pressure groups. Alpha = 0.05. Submit the following: a) Provide all SAS syntax used to answer this question b) State the null and alternative hypotheses c) Check and comment if the assumption/requirement is met for the test d) Write down the test statistic and p-value e) Using the p-value method, state your conclusion for the null hypothesis and provide a concluding statement for your research question. Include appropriate proportions to support your conclusion
I was unsure of which test to do so I did a Chi-square test because it seemed to me to be the most appropriate test. These are the outputs I got:
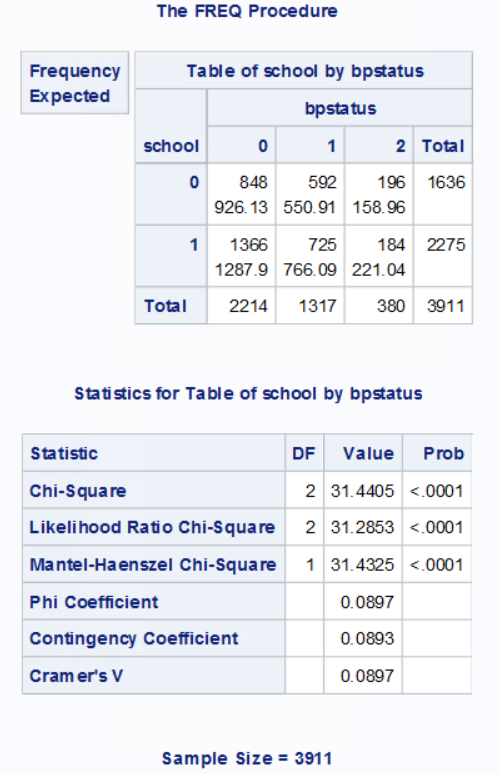
(bpstatus=0 is systolic bp when it is less than 120, 1 is when systolic bp is greater than equal to 120 and less than equal to 140, 2 is systolic bp greater than 140)
Code or Value Value Description 1 2 3 Less than 9th grade 9-11th grade (Includes 12th grade with no diploma) High school graduate/GED or equivalent Some college or AA degree College graduate or above 5 The FREQ Procedure Frequency Expected Table of school by bpstatus school bpstatus 0 1 2 Total 848 592 196 1636 926. 13 550.91 158.96 0 1 2275 1366 725 184 1287.9 766.09 221.04 Total 2214 1317 380 3911 Statistics for Table of school by bpstatus Statistic DF Value Prob Chi-Square Likelihood Ratio Chi-Square 2 31.4405 <.0001 mantel-ha enszel chi-square phi coefficient contingency cramer v sample size="3911" code or value description less than grade with no diploma high school graduate equivalent some college aa degree above the freq procedure frequency expected table of by bpstatus total statistics for statistic df prob likelihood ratio>
Step by Step Solution
There are 3 Steps involved in it

Get step-by-step solutions from verified subject matter experts