

Question: Growth Audit Trail - Statistics Accuracy Measures AIC BIC Mean Absolute Percentage Error (MAPE) R-Square Adjusted R-Square Root Mean Square Error Value 66.28 66.07 39.3796
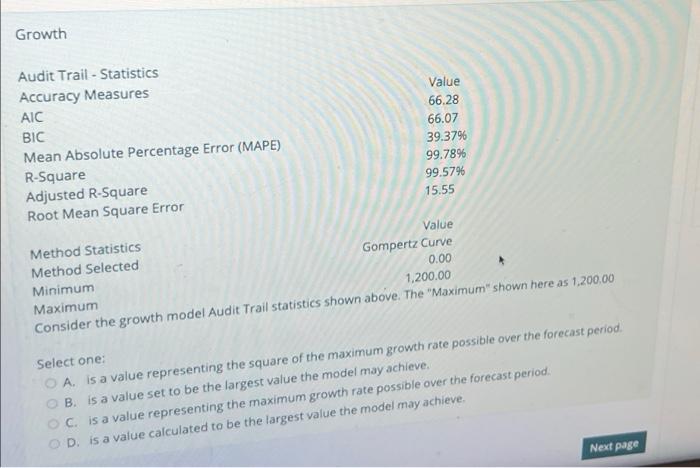
Growth Audit Trail - Statistics Accuracy Measures AIC BIC Mean Absolute Percentage Error (MAPE) R-Square Adjusted R-Square Root Mean Square Error Value 66.28 66.07 39.3796 99.78% 99.57% 15.55 Value Method Statistics Method Selected Gompertz Curve Minimum 0.00 Maximum 1,200.00 Consider the growth model Audit Trail statistics shown above. The "Maximum" shown here as 1.200,00 Select one: O A. is a value representing the square of the maximum growth rate possible over the forecast period, B. is a value set to be the largest value the model may achieve. C. is a value representing the maximum growth rate possible over the forecast period. OD is a value calculated to be the largest value the model may achieve. Next page
Step by Step Solution
There are 3 Steps involved in it

Get step-by-step solutions from verified subject matter experts