

Question: Guidelines for optimal capital structure in Blaine Kitchenware Case The focus of this case is to understand how leverage should affect beta and the impact
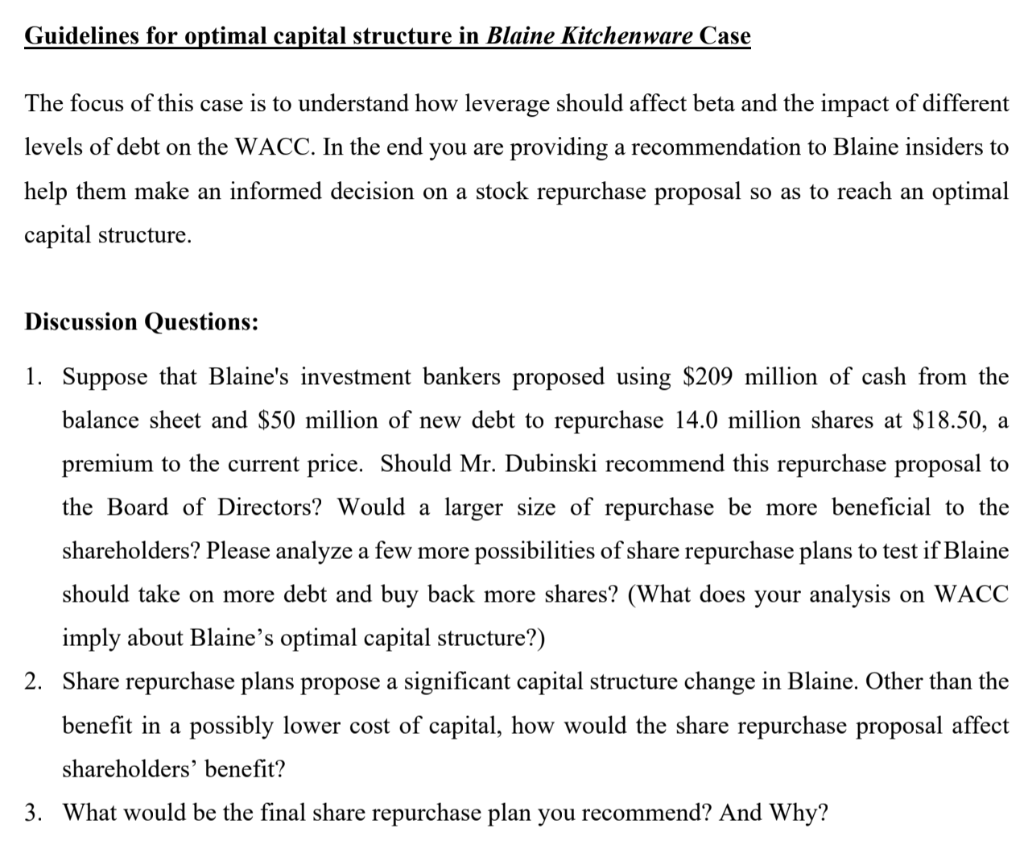
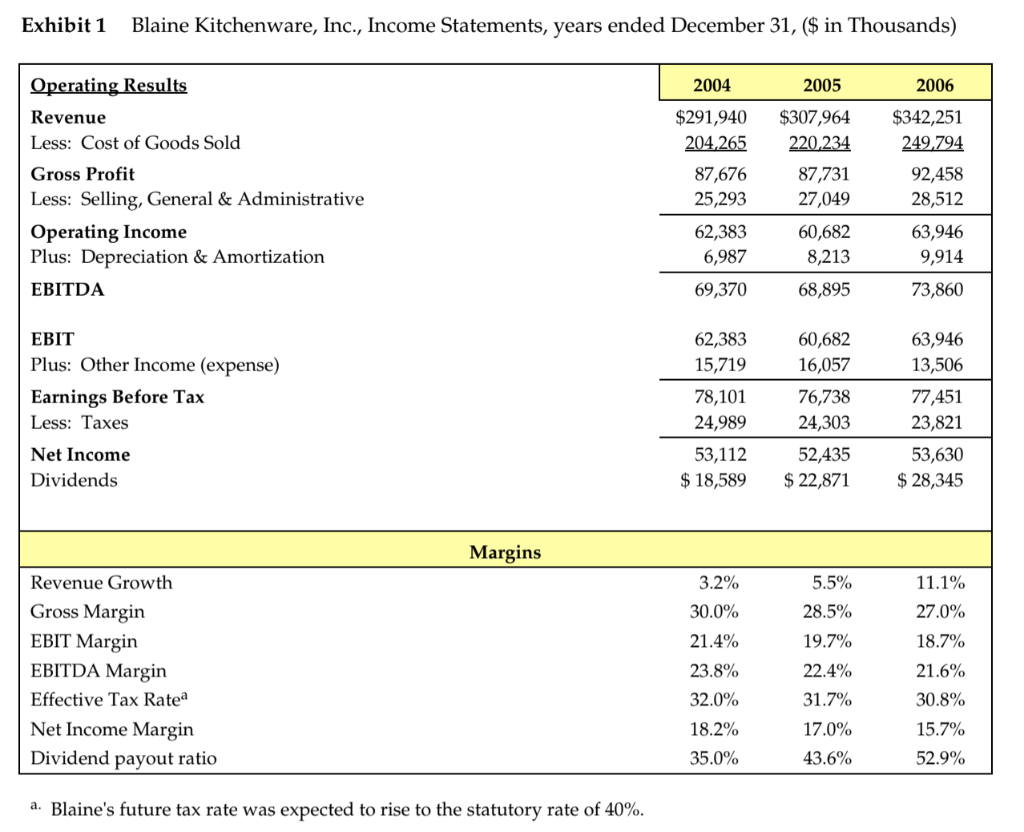
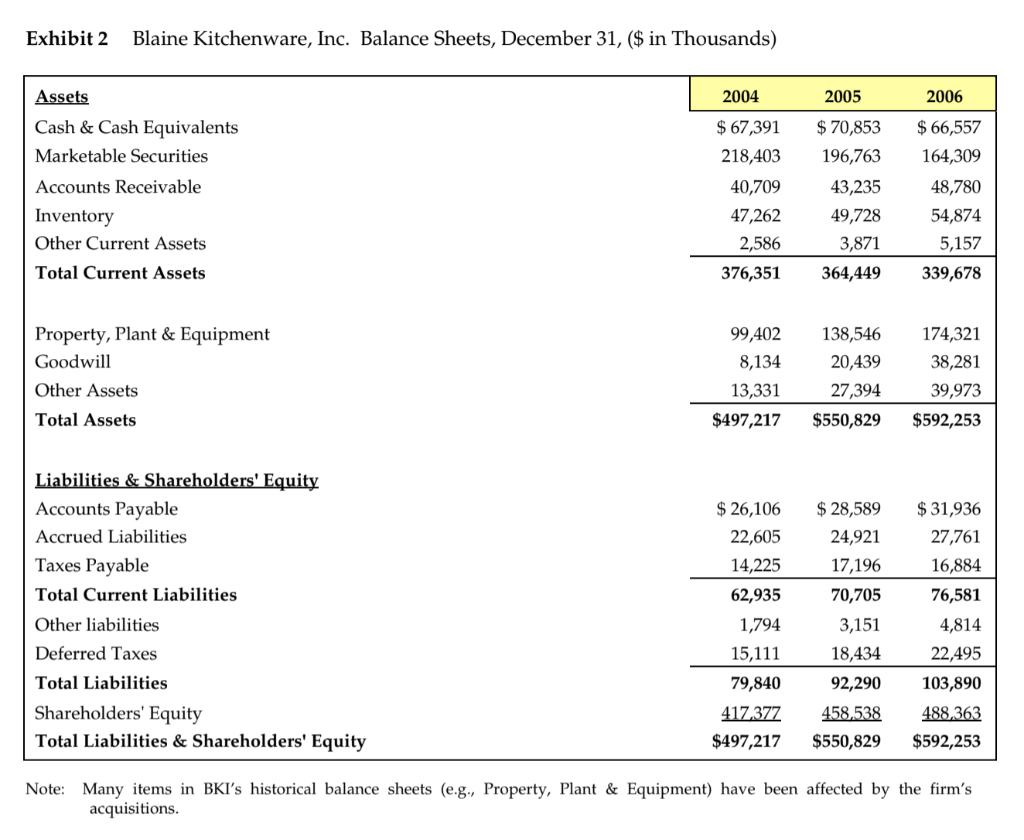
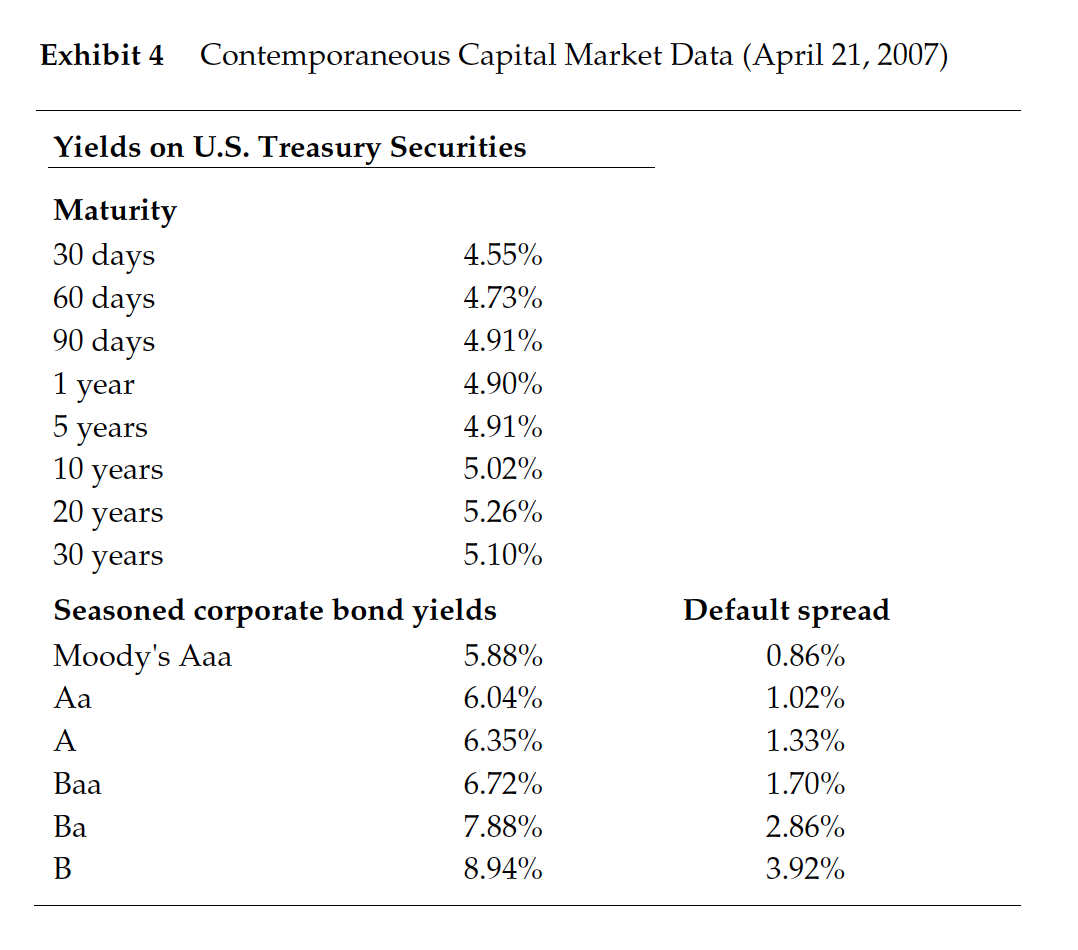
Guidelines for optimal capital structure in Blaine Kitchenware Case The focus of this case is to understand how leverage should affect beta and the impact of different levels of debt on the WACC. In the end you are providing a recommendation to Blaine insiders to help them make an informed decision on a stock repurchase proposal so as to reach an optimal capital structure. Discussion Questions: 1. Suppose that Blaine's investment bankers proposed using $209 million of cash from the balance sheet and $50 million of new debt to repurchase 14.0 million shares at $18.50, a premium to the current price. Should Mr. Dubinski recommend this repurchase proposal to the Board of Directors? Would a larger size of repurchase be more beneficial to the shareholders? Please analyze a few more possibilities of share repurchase plans to test if Blaine should take on more debt and buy back more shares? (What does your analysis on WACC imply about Blaines optimal capital structure?) 2. Share repurchase plans propose a significant capital structure change in Blaine. Other than the benefit in a possibly lower cost of capital, how would the share repurchase proposal affect shareholders' benefit? 3. What would be the final share repurchase plan you recommend? And Why? Exhibit 1 Blaine Kitchenware, Inc., Income Statements, years ended December 31, ($ in Thousands) 2004 2005 2006 $291,940 204,265 $342,251 249.794 Operating Results Revenue Less: Cost of Goods Sold Gross Profit Less: Selling, General & Administrative Operating Income Plus: Depreciation & Amortization EBITDA 87,676 25,293 62,383 6,987 $307,964 220,234 87,731 27,049 60,682 92,458 28,512 63,946 9,914 73,860 8,213 69,370 68,895 EBIT Plus: Other Income (expense) Earnings Before Tax Less: Taxes 62,383 15,719 78,101 24,989 53,112 $ 18,589 60,682 16,057 76,738 24,303 52,435 $ 22,871 63,946 13,506 77,451 23,821 53,630 $ 28,345 Net Income Dividends Margins 3.2% 5.5% 11.1% 28.5% 27.0% 30.0% 21.4% 18.7% Revenue Growth Gross Margin EBIT Margin EBITDA Margin Effective Tax Ratea Net Income Margin Dividend payout ratio 23.8% 32.0% 19.7% 22.4% 31.7% 21.6% 30.8% 17.0% 18.2% 35.0% 15.7% 52.9% 43.6% a. Blaine's future tax rate was expected to rise to the statutory rate of 40%. Exhibit 2 Blaine Kitchenware, Inc. Balance Sheets, December 31, ($ in Thousands) 2004 2005 2006 Assets Cash & Cash Equivalents Marketable Securities Accounts Receivable Inventory Other Current Assets Total Current Assets $ 67,391 218,403 40,709 47,262 2,586 376,351 $ 70,853 196,763 43,235 49,728 3,871 364,449 $ 66,557 164,309 48,780 54,874 5,157 339,678 Property, Plant & Equipment Goodwill 99,402 8,134 13,331 $497,217 138,546 20,439 27,394 $550,829 174,321 38,281 39,973 $592,253 Other Assets Total Assets Liabilities & Shareholders' Equity Accounts Payable Accrued Liabilities Taxes Payable Total Current Liabilities Other liabilities Deferred Taxes $ 26,106 22,605 14,225 62,935 1,794 15,111 79,840 417 377 $497,217 $ 28,589 24,921 17,196 70,705 3,151 $ 31,936 27,761 16,884 76,581 4,814 22,495 103,890 488,363 $592,253 Total Liabilities 18,434 92,290 458,538 $550,829 Shareholders' Equity Total Liabilities & Shareholders' Equity Note: Many items in BKI's historical balance sheets (e.g., Property, Plant & Equipment) have been affected by the firm's acquisitions. Exhibit 3 Selected Operating and Financial Data for Public Kitchenware Producers, 12 months ended December 31, 2006, (S in Thousands) Easy Living Systems $ 188,955 Revenue EBIT EBITDA Net income Home & Hearth Design $ 589,747 106,763 119,190 $ 53,698 Auto Tech Appliances $18,080,000 2,505,200 3,055,200 $1,416,012 XQL Corp. S4,313 300 721,297 796,497 $ 412,307 Bunkerhill, Inc. $3,671,100 566,099 610,399 S 335,073 Blaine Kitchenware $ 342,251 63,946 73,860 $ 53,630 19,613 23,356 $ 13,173 Cash & securities Net working capitala Net fixed assets Total assets $ 21,495 54,316 900,803 S 976,613 $ 536,099 1,247,520 7,463,564 S9,247,183 $ 21,425 353,691 3,322,837 $3,697,952 $ 153,680 334,804 815,304 $1,303,788 $ 242,102 21,220 68,788 $ 332,110 $ 230,866 32,231 174,321 $ 592,253 S(230,866) Net debtb Total debt Book equity $ 350,798 372 293 475,377 S4,437,314 4,973,413 3,283,000 $ 950,802 972,227 2,109,400 $ 238,056 391,736 804,400 $ (64,800) 177,302 94,919 488,363 Market capitalization Enterprise value (MVIC) 776,427 $1,127,226 13,978,375 $18,415,689 5,290,145 $6,240,947 3,962,780 $4,200,836 418,749 $353,949 959,596 $ 728,730 Equity beta 1.03 1.24 0.96 0.92 0.67 0.56 LTM Trading Multiples MVIC/Revenue MVIC/EBIT MVIC/EBITDA Market/Book equity 1.91x 10.56x 1.14x 7.42x 2.13x 11.40x 1.02x 7.35x 6.03x 4.26x 1.45x 8.65x 7.84 2.51% 1.87x 18.05x .15x 4.41% 1.63x 4.93x 1.96x Net Debt/Equity Net Debt/Enterprise Value 45.18% 31.12% 31.74% 24.10% 17.97% 15.23% 6.01% 5.67% -15.47% -18.31% -24.06% -31.68% 2. Net working capital excludes cash and securities. b. Net debt is total long-term and short-term debt less excess cash. Exhibit 4 Contemporaneous Capital Market Data (April 21, 2007) Yields on U.S. Treasury Securities Maturity 30 days 60 days 90 days 1 year 5 years 4.55% 4.73% 4.91% 4.90% 4.91% 5.02% 5.26% 5.10% 10 years 20 years 30 years Seasoned corporate bond yields Moody's Aaa 5.88% 6.04% A 6.35% Baa 6.72% Ba 7.88% B 8.94% Default spread 0.86% 1.02% 1.33% 1.70% 2.86% 3.92% Guidelines for optimal capital structure in Blaine Kitchenware Case The focus of this case is to understand how leverage should affect beta and the impact of different levels of debt on the WACC. In the end you are providing a recommendation to Blaine insiders to help them make an informed decision on a stock repurchase proposal so as to reach an optimal capital structure. Discussion Questions: 1. Suppose that Blaine's investment bankers proposed using $209 million of cash from the balance sheet and $50 million of new debt to repurchase 14.0 million shares at $18.50, a premium to the current price. Should Mr. Dubinski recommend this repurchase proposal to the Board of Directors? Would a larger size of repurchase be more beneficial to the shareholders? Please analyze a few more possibilities of share repurchase plans to test if Blaine should take on more debt and buy back more shares? (What does your analysis on WACC imply about Blaines optimal capital structure?) 2. Share repurchase plans propose a significant capital structure change in Blaine. Other than the benefit in a possibly lower cost of capital, how would the share repurchase proposal affect shareholders' benefit? 3. What would be the final share repurchase plan you recommend? And Why? Exhibit 1 Blaine Kitchenware, Inc., Income Statements, years ended December 31, ($ in Thousands) 2004 2005 2006 $291,940 204,265 $342,251 249.794 Operating Results Revenue Less: Cost of Goods Sold Gross Profit Less: Selling, General & Administrative Operating Income Plus: Depreciation & Amortization EBITDA 87,676 25,293 62,383 6,987 $307,964 220,234 87,731 27,049 60,682 92,458 28,512 63,946 9,914 73,860 8,213 69,370 68,895 EBIT Plus: Other Income (expense) Earnings Before Tax Less: Taxes 62,383 15,719 78,101 24,989 53,112 $ 18,589 60,682 16,057 76,738 24,303 52,435 $ 22,871 63,946 13,506 77,451 23,821 53,630 $ 28,345 Net Income Dividends Margins 3.2% 5.5% 11.1% 28.5% 27.0% 30.0% 21.4% 18.7% Revenue Growth Gross Margin EBIT Margin EBITDA Margin Effective Tax Ratea Net Income Margin Dividend payout ratio 23.8% 32.0% 19.7% 22.4% 31.7% 21.6% 30.8% 17.0% 18.2% 35.0% 15.7% 52.9% 43.6% a. Blaine's future tax rate was expected to rise to the statutory rate of 40%. Exhibit 2 Blaine Kitchenware, Inc. Balance Sheets, December 31, ($ in Thousands) 2004 2005 2006 Assets Cash & Cash Equivalents Marketable Securities Accounts Receivable Inventory Other Current Assets Total Current Assets $ 67,391 218,403 40,709 47,262 2,586 376,351 $ 70,853 196,763 43,235 49,728 3,871 364,449 $ 66,557 164,309 48,780 54,874 5,157 339,678 Property, Plant & Equipment Goodwill 99,402 8,134 13,331 $497,217 138,546 20,439 27,394 $550,829 174,321 38,281 39,973 $592,253 Other Assets Total Assets Liabilities & Shareholders' Equity Accounts Payable Accrued Liabilities Taxes Payable Total Current Liabilities Other liabilities Deferred Taxes $ 26,106 22,605 14,225 62,935 1,794 15,111 79,840 417 377 $497,217 $ 28,589 24,921 17,196 70,705 3,151 $ 31,936 27,761 16,884 76,581 4,814 22,495 103,890 488,363 $592,253 Total Liabilities 18,434 92,290 458,538 $550,829 Shareholders' Equity Total Liabilities & Shareholders' Equity Note: Many items in BKI's historical balance sheets (e.g., Property, Plant & Equipment) have been affected by the firm's acquisitions. Exhibit 3 Selected Operating and Financial Data for Public Kitchenware Producers, 12 months ended December 31, 2006, (S in Thousands) Easy Living Systems $ 188,955 Revenue EBIT EBITDA Net income Home & Hearth Design $ 589,747 106,763 119,190 $ 53,698 Auto Tech Appliances $18,080,000 2,505,200 3,055,200 $1,416,012 XQL Corp. S4,313 300 721,297 796,497 $ 412,307 Bunkerhill, Inc. $3,671,100 566,099 610,399 S 335,073 Blaine Kitchenware $ 342,251 63,946 73,860 $ 53,630 19,613 23,356 $ 13,173 Cash & securities Net working capitala Net fixed assets Total assets $ 21,495 54,316 900,803 S 976,613 $ 536,099 1,247,520 7,463,564 S9,247,183 $ 21,425 353,691 3,322,837 $3,697,952 $ 153,680 334,804 815,304 $1,303,788 $ 242,102 21,220 68,788 $ 332,110 $ 230,866 32,231 174,321 $ 592,253 S(230,866) Net debtb Total debt Book equity $ 350,798 372 293 475,377 S4,437,314 4,973,413 3,283,000 $ 950,802 972,227 2,109,400 $ 238,056 391,736 804,400 $ (64,800) 177,302 94,919 488,363 Market capitalization Enterprise value (MVIC) 776,427 $1,127,226 13,978,375 $18,415,689 5,290,145 $6,240,947 3,962,780 $4,200,836 418,749 $353,949 959,596 $ 728,730 Equity beta 1.03 1.24 0.96 0.92 0.67 0.56 LTM Trading Multiples MVIC/Revenue MVIC/EBIT MVIC/EBITDA Market/Book equity 1.91x 10.56x 1.14x 7.42x 2.13x 11.40x 1.02x 7.35x 6.03x 4.26x 1.45x 8.65x 7.84 2.51% 1.87x 18.05x .15x 4.41% 1.63x 4.93x 1.96x Net Debt/Equity Net Debt/Enterprise Value 45.18% 31.12% 31.74% 24.10% 17.97% 15.23% 6.01% 5.67% -15.47% -18.31% -24.06% -31.68% 2. Net working capital excludes cash and securities. b. Net debt is total long-term and short-term debt less excess cash. Exhibit 4 Contemporaneous Capital Market Data (April 21, 2007) Yields on U.S. Treasury Securities Maturity 30 days 60 days 90 days 1 year 5 years 4.55% 4.73% 4.91% 4.90% 4.91% 5.02% 5.26% 5.10% 10 years 20 years 30 years Seasoned corporate bond yields Moody's Aaa 5.88% 6.04% A 6.35% Baa 6.72% Ba 7.88% B 8.94% Default spread 0.86% 1.02% 1.33% 1.70% 2.86% 3.92%
Step by Step Solution
There are 3 Steps involved in it

Get step-by-step solutions from verified subject matter experts