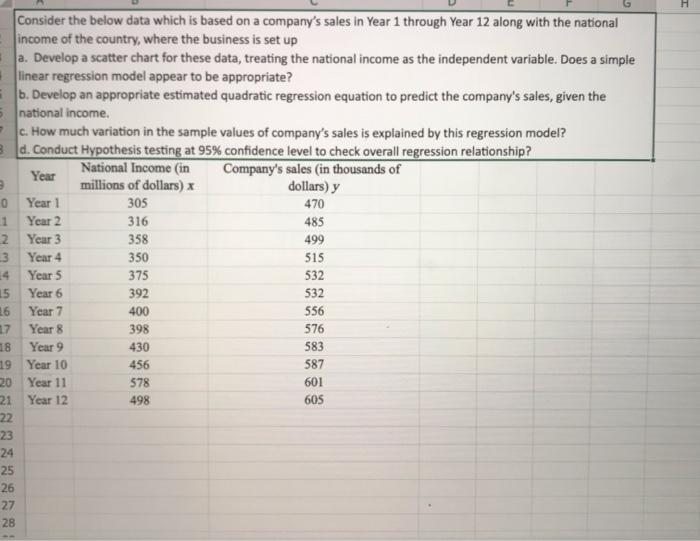
Question: H Consider the below data which is based on a company's sales in Year 1 through Year 12 along with the national income of the

H Consider the below data which is based on a
H Consider the below data which is based on a company's sales in Year 1 through Year 12 along with the national income of the country, where the business is set up a. Develop a scatter chart for these data, treating the national income as the independent variable. Does a simple linear regression model appear to be appropriate? b. Develop an appropriate estimated quadratic regression equation to predict the company's sales, given the national income. c. How much variation in the sample values of company's sales is explained by this regression model? d. Conduct Hypothesis testing at 95% confidence level to check overall regression relationship? National Income (in Year Company's sales (in thousands of millions of dollars) x dollars) y 0 Year 1 305 470 1 Year 2 316 485 2 Year 3 358 499 13 Year 4 350 515 Year 5 375 532 15 Year 6 392 16 Year 7 400 556 17 Year 8 398 576 Year 9 19 Year 10 456 587 20 Year 11 578 601 21 Year 12 498 605 22 23 24 25 26 27 28 532 18 430 583 1. What is an observation? 22. During data preparation stage, explain the treament of missing data? 3 3. Explain Hierarchical Clustering? 4. Explain K-means clustering? 55. Explain Hierarchical Clustering Versus K-Means Clustering? 6 7 4 9 10 11 12 13 15 16 17 18 19 20 21 22 23 24 25 26 27 28 29

Step by Step Solution

There are 3 Steps involved in it

1 Expert Approved Answer
Step: 1 Unlock blur-text-image
Question Has Been Solved by an Expert!

Get step-by-step solutions from verified subject matter experts

Step: 2 Unlock
Step: 3 Unlock

Students Have Also Explored These Related General Management Questions!