

Question: H COULD YOU HELP ME ASAP PLEASE! Problem 3-26 The following data were collected during a study of consumer buying patterns: Observation x y Observation
H COULD YOU HELP ME ASAP PLEASE!
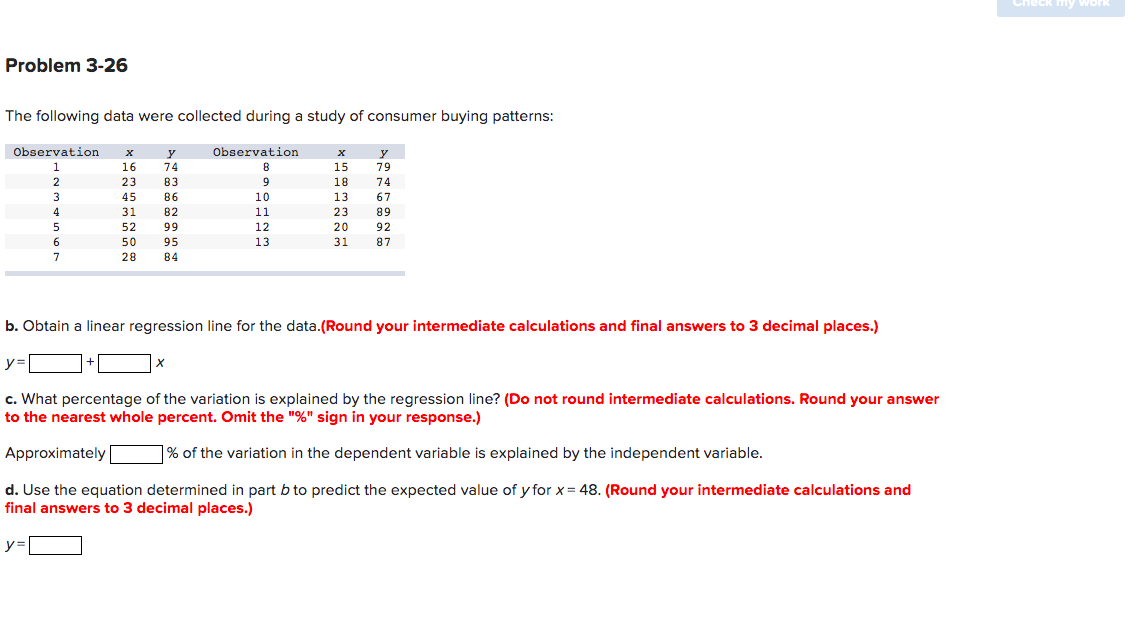
Problem 3-26 The following data were collected during a study of consumer buying patterns: Observation x y Observation x y l 16 74 3 15 79 2 23 33 9 13 74 3 45 36 10 13 6? 4 31 32 ll 23 39 5 52 99 12 20 92 6 SO 95 13 31 B? 1' 23 34 b. Obtain a linear regression line for the data.{Round your intermediate calculations and nal answers to 3 decimal places.) y: + x c. What percentage of the variation is explained by the regression line? (Do not round intermediate calculations. Round your answer to the nearest whole percent. Omit the \"99' sign in your response.) Approximately '96 of the variation in the dependent variable is explained by the independent variable. C. Use the equation determined in part bto predict the expected value of yfor x = 48. (Round your intermediate calculations and final answers to 3 decimal places.) y
Step by Step Solution
There are 3 Steps involved in it

Get step-by-step solutions from verified subject matter experts