

Question: h. Faubert exchanged an old machine for a similar machine on December 31, Year 5. Original cost of the old machine was $66,000; Updated
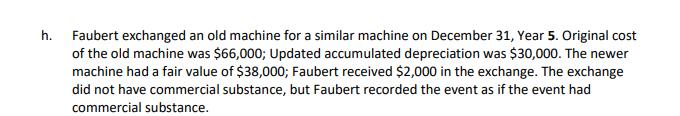
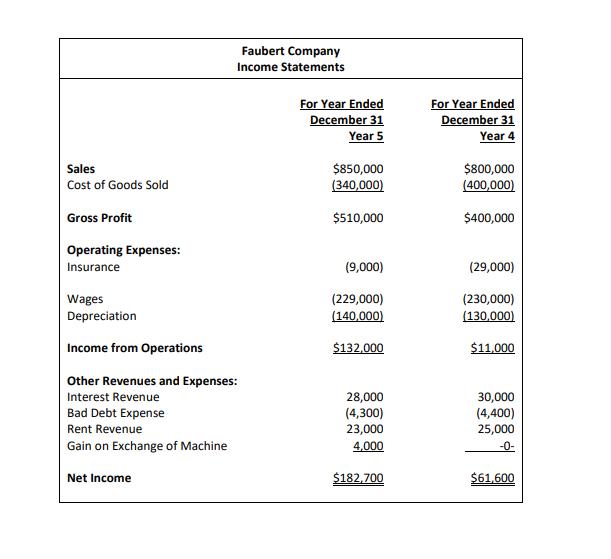
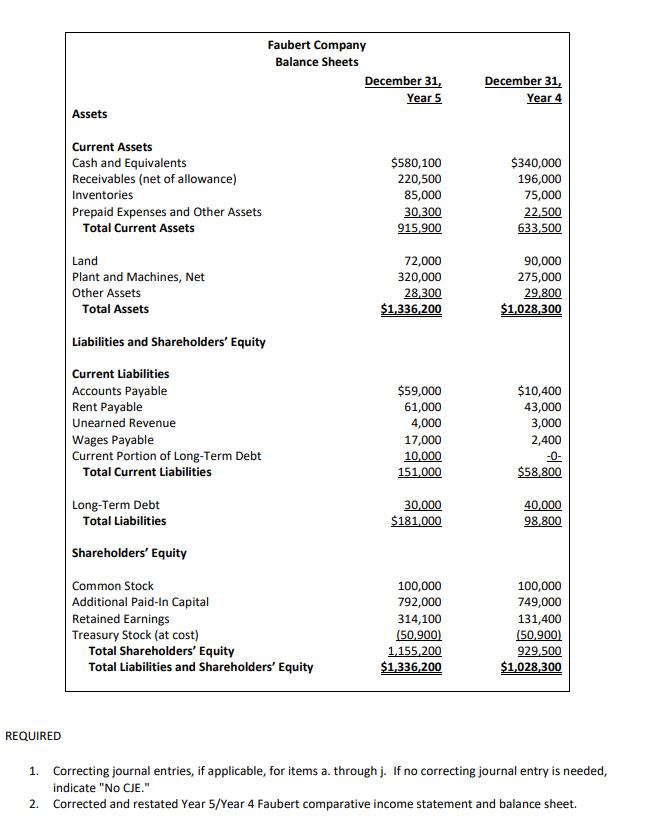
h. Faubert exchanged an old machine for a similar machine on December 31, Year 5. Original cost of the old machine was $66,000; Updated accumulated depreciation was $30,000. The newer machine had a fair value of $38,000; Faubert received $2,000 in the exchange. The exchange did not have commercial substance, but Faubert recorded the event as if the event had commercial substance. Sales Cost of Goods Sold Gross Profit Operating Expenses: Insurance Wages Depreciation Income from Operations Other Revenues and Expenses: Interest Revenue Bad Debt Expense Rent Revenue Gain on Exchange of Machine Faubert Company Income Statements Net Income For Year Ended December 31 Year 5 $850,000 (340,000) $510,000 (9,000) (229,000) (140,000) $132,000 28,000 (4,300) 23,000 4,000 $182,700 For Year Ended December 31 Year 4 $800,000 (400,000) $400,000 (29,000) (230,000) (130,000) $11,000 30,000 (4,400) 25,000 -0- $61,600 REQUIRED 1. 2. Assets Current Assets Cash and Equivalents Receivables (net of allowance) Inventories Prepaid Expenses and Other Assets Total Current Assets Land Plant and Machines, Net Other Assets Total Assets Liabilities and Shareholders' Equity Current Liabilities Accounts Payable Rent Payable Unearned Revenue Wages Payable Current Portion of Long-Term Debt Total Current Liabilities Long-Term Debt Total Liabilities Shareholders' Equity Common Stock Additional Paid-In Capital Retained Earnings Treasury Stock (at cost) Faubert Company Balance Sheets Total Shareholders' Equity Total Liabilities and Shareholders' Equity December 31, Year 5 $580,100 220,500 85,000 30,300 915,900 72,000 320,000 28,300 $1,336,200 $59,000 61,000 4,000 17,000 10,000 151,000 30,000 $181,000 100,000 792,000 314,100 (50,900) 1,155,200 $1,336,200 December 31, Year 4 $340,000 196,000 75,000 22,500 633,500 90,000 275,000 29,800 $1,028,300 $10,400 43,000 3,000 2,400 $58,800 40,000 98,800 100,000 749,000 131,400 (50,900) 929,500 $1,028,300 Correcting journal entries, if applicable, for items a. through j. If no correcting journal entry is needed, indicate "No CJE." Corrected and restated Year 5/Year 4 Faubert comparative income statement and balance sheet.
Step by Step Solution
3.35 Rating (155 Votes )
There are 3 Steps involved in it

Get step-by-step solutions from verified subject matter experts