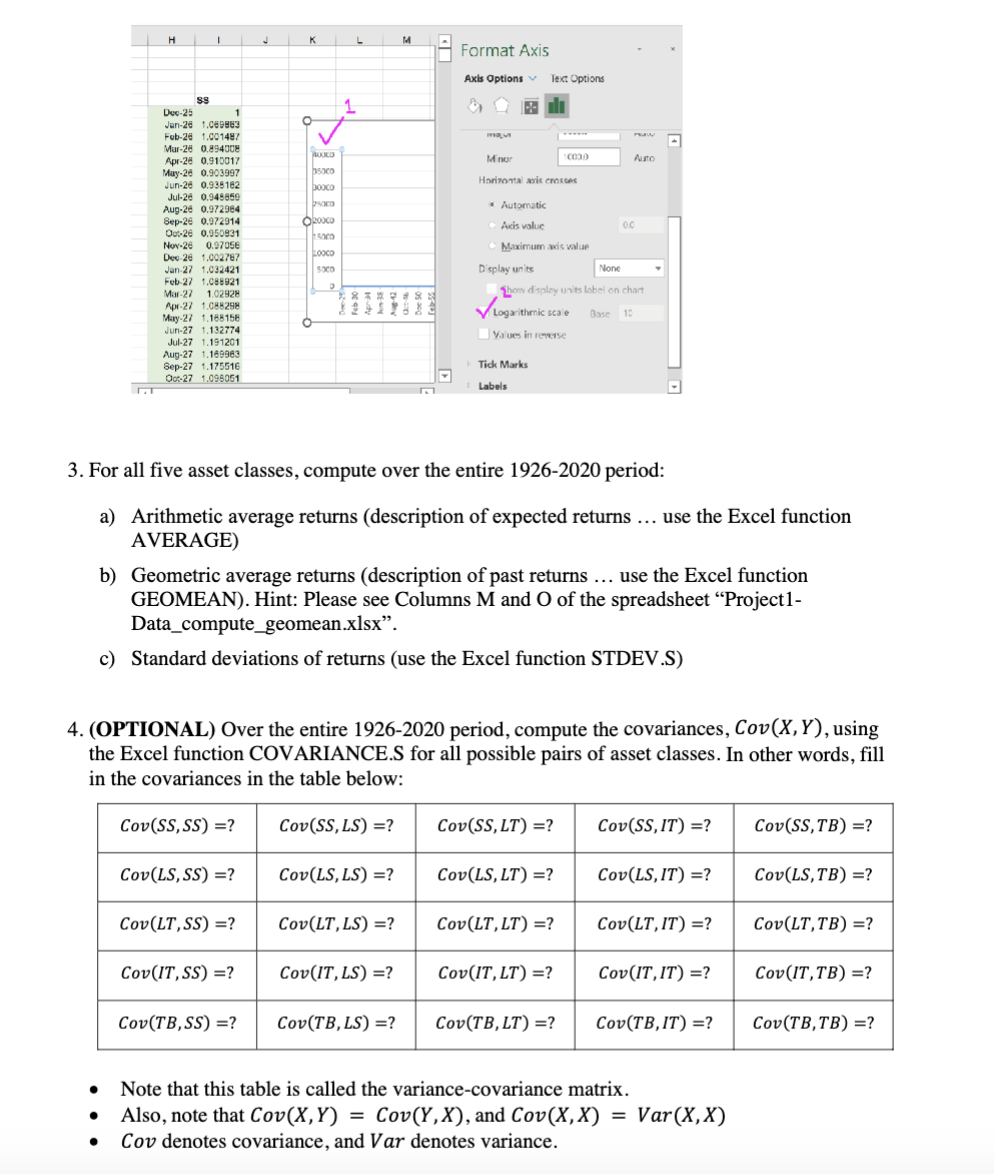
Question: H K M Format Axis Axis Options . Text Options 159 Dog-25 Jan-26 1.089 983 # 1.001487 Mar-26 0.894008 Apr-24 0.910017 Minor 10020 Aunto May-26
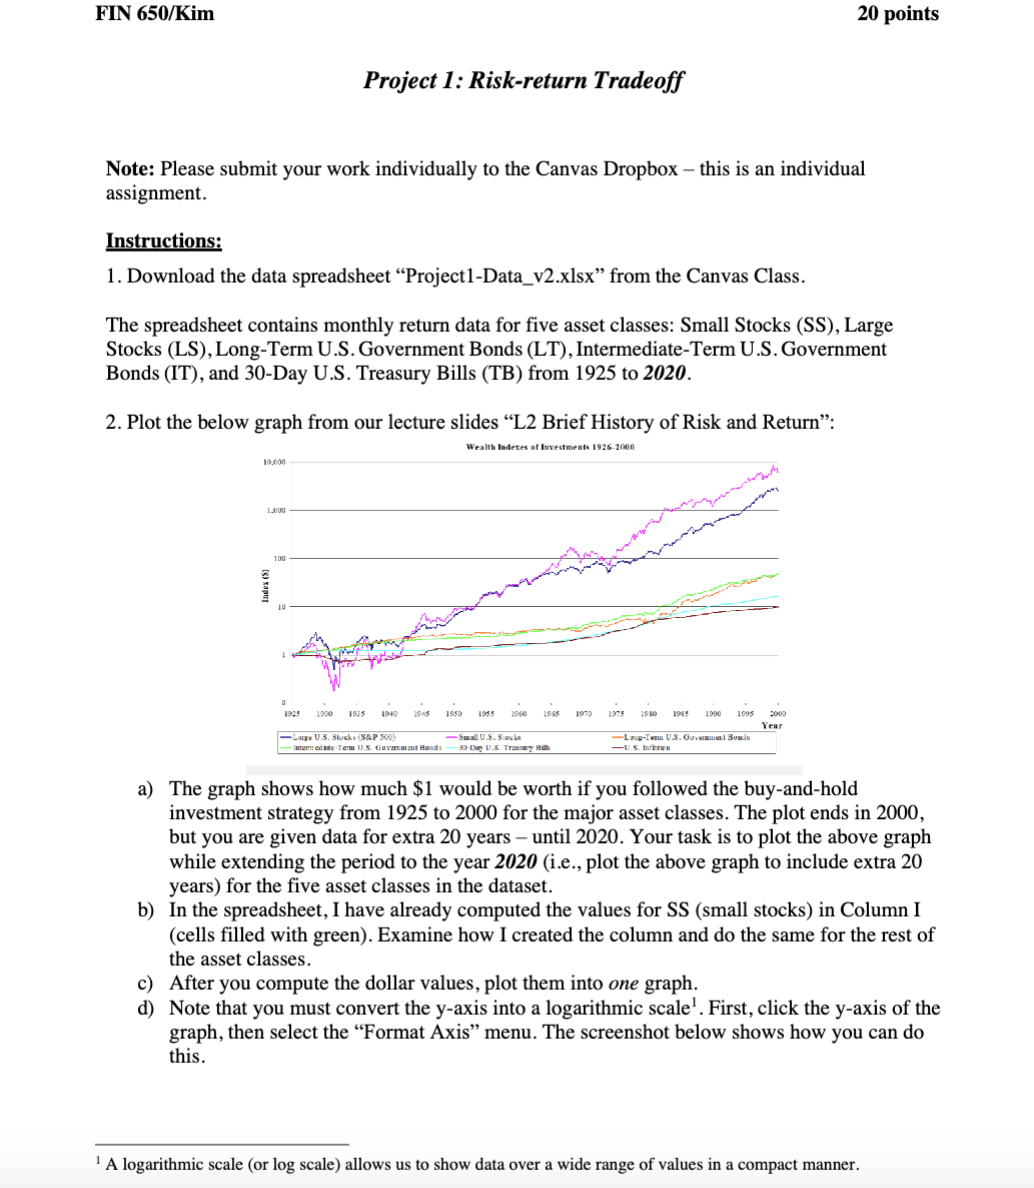
H K M Format Axis Axis Options . Text Options 159 Dog-25 Jan-26 1.089 983 # 1.001487 Mar-26 0.894008 Apr-24 0.910017 Minor 10020 Aunto May-26 0,903997 Jun-26 0.938182 pooco Horizontal avis crosses Jul-26 0.949859 Aug-26 0.972984 . Automatic Sep-26 0.972914 Oct.26 0.950831 Axis value Nov-26 0.97056 Maximum ads value Dog-26 1.002787 Jan-27 1.032421 Display units None 1.088921 Mar-27 1.02928 how display units label on chart Apr-27 May-27 1.168156 Logarithmic scale Base 10 Jun-27 1 Jul-27 1.191201 Values in reverse Aug-27 1.169963 Sep-27 1.175516 Tick Marks Dot-27 1.095051 Labels 3. For all five asset classes, compute over the entire 1926-2020 period: a) Arithmetic average returns (description of expected returns ... use the Excel function AVERAGE) b) Geometric average returns (description of past returns ... use the Excel function GEOMEAN). Hint: Please see Columns M and O of the spreadsheet "Project1- Data_compute_geomean.xlsx". c) Standard deviations of returns (use the Excel function STDEV.S) 4. (OPTIONAL) Over the entire 1926-2020 period, compute the covariances, Cov(X, Y), using the Excel function COVARIANCE.S for all possible pairs of asset classes. In other words, fill in the covariances in the table below: Cov(SS, SS) =? Cov(SS, LS) =? Cov(SS, LT) =? Cov(SS, IT) =? Cov(SS, TB) =? Cov(LS, SS) =? Cov(LS, LS) =? Cov(LS, LT) =? Cov(LS, IT) =? Cov(LS, TB) =? Cov(LT, SS) =? Cov(LT, LS) =? Cov(LT, LT) =? Cov(LT, IT) =? Cov(LT, TB) =? Cov(IT, SS) =? Cov(IT, LS) =? Cov(IT, LT) =? Cov(IT, IT) =? Cov(IT, TB) =? Cov(TB, SS) =? Cov(TB, LS) =? Cov(TB, LT) =? Cov(TB, IT) =? Cov(TB, TB) =? Note that this table is called the variance-covariance matrix. Also, note that Cov(X, Y) = Cov(Y, X), and Cov(X, X) = Var(X, X) Cov denotes covariance, and Var denotes variance.FIN 650/Kim 20 points Project 1: Risk-return Tradeoff Note: Please submit your work individually to the Canvas Dropbox - this is an individual assignment. Instructions: 1. Download the data spreadsheet "Project1-Data_v2.xlsx" from the Canvas Class. The spreadsheet contains monthly return data for five asset classes: Small Stocks (SS), Large Stocks (LS), Long-Term U.S. Government Bonds (LT), Intermediate-Term U.S. Government Bonds (IT), and 30-Day U.S. Treasury Bills (TB) from 1925 to 2020. 2. Plot the below graph from our lecture slides "L2 Brief History of Risk and Return": Wealth Indexes of Investments 1926-2060 10,000 100 Index (3] 10 1925 1930 1935 1940 29 5 1559 1955 2960 1965 1950 1975 1950 1590 1995 - Lags V.3. Stocks (SAP 500) -Small U.S. Sucks -Laug-I vin U.S. - Internedme Term U.S. Government Hand -10.Dur U.S. Trasay Hill a) The graph shows how much $1 would be worth if you followed the buy-and-hold investment strategy from 1925 to 2000 for the major asset classes. The plot ends in 2000, but you are given data for extra 20 years - until 2020. Your task is to plot the above graph while extending the period to the year 2020 (i.e., plot the above graph to include extra 20 years) for the five asset classes in the dataset. b) In the spreadsheet, I have already computed the values for SS (small stocks) in Column I (cells filled with green). Examine how I created the column and do the same for the rest of the asset classes. c) After you compute the dollar values, plot them into one graph. d) Note that you must convert the y-axis into a logarithmic scale . First, click the y-axis of the graph, then select the "Format Axis" menu. The screenshot below shows how you can do this A logarithmic scale (or log scale) allows us to show data over a wide range of values in a compact manner
Step by Step Solution
There are 3 Steps involved in it
1 Expert Approved Answer
Step: 1 Unlock
Question Has Been Solved by an Expert!
Get step-by-step solutions from verified subject matter experts
Step: 2 Unlock
Step: 3 Unlock
Students Have Also Explored These Related Accounting Questions!