

Question: H3. fD H K A B C 9 1. Create a histogram for each column 10 2. Which of these follow a normal distribution? 11
H3.
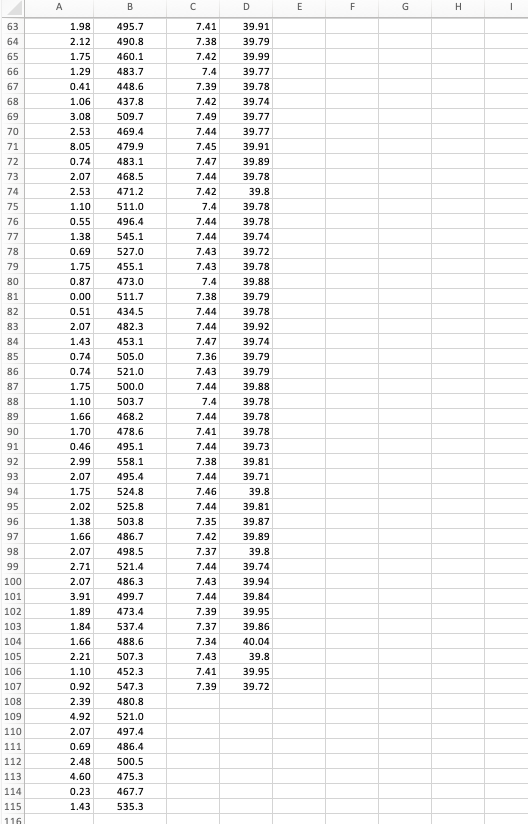
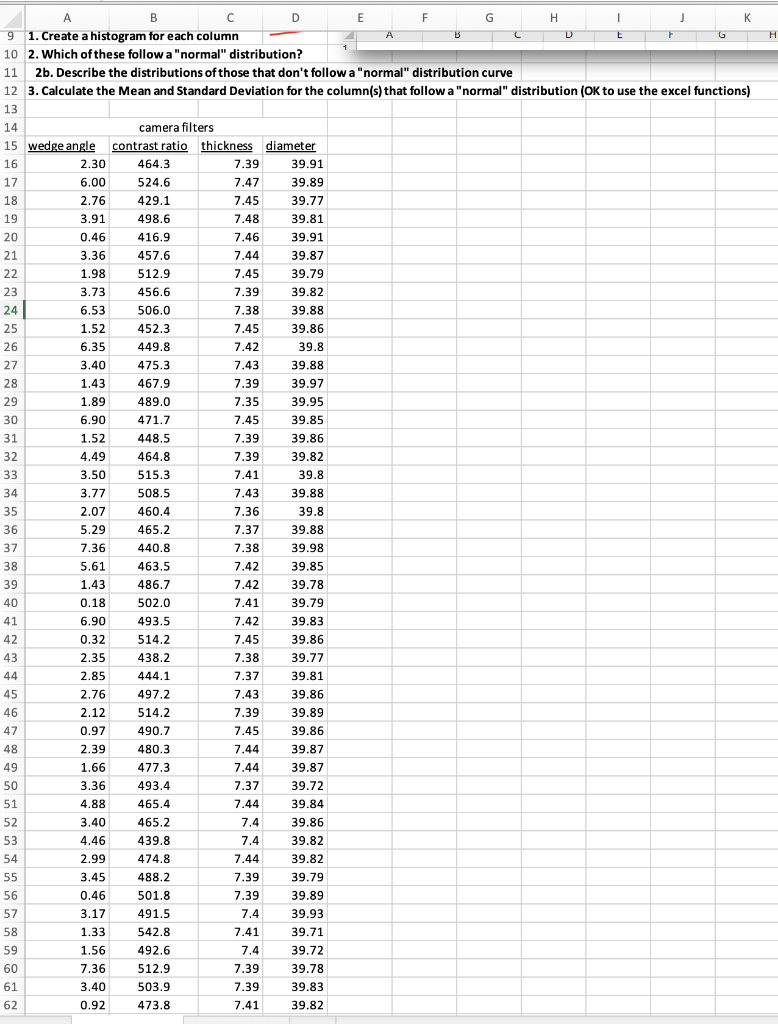
\fD H K A B C 9 1. Create a histogram for each column 10 2. Which of these follow a "normal" distribution? 11 2b. Describe the distributions of those that don't follow a "normal" distribution curve 3. Calculate the Mean and Standard Deviation for the column(s) that follow a "normal" distribution (OK to use the excel functions) 13 14 camera filters 15 wedge angle contrast ratio thickness diameter 16 2.30 464.3 7.39 39.91 17 6.00 524.6 7.47 39.89 18 2.76 429.1 7.45 39.77 19 3.91 498.6 7.48 39.81 20 0.46 416.9 7.46 39.91 3.36 457.6 7.44 39.87 21 22 1.98 512.9 7.45 39.79 23 3.73 456.6 7.39 39.82 24 6.53 506.0 7.38 39.88 25 1.52 452.3 7.45 39.86 26 6.35 449.8 7.42 39.8 27 3.40 475.3 7.43 39.88 28 1.43 467.9 7.39 39.97 29 1.89 489.0 7.35 39.95 30 6.90 471.7 7.45 39.85 1.52 448.5 39.86 31 7.39 32 4.49 464.8 7.39 39.82 33 3.50 515.3 7.41 39.8 34 3.77 508.5 7.43 39.88 35 2.07 460.4 7.36 39.8 36 5.29 465.2 7.37 39.88 37 7.36 440.8 7.38 39.98 38 5.61 463.5 7.42 39.85 39 1.43 486.7 7.42 39.78 40 0.18 502.0 7.41 39.79 41 6.90 493.5 7.42 39.83 42 0.32 514.2 7.45 39.86 43 2.35 438.2 7.38 39.77 44 2.85 444.1 7.37 39.81 45 2.76 497.2 7.43 39.86 46 2.12 514.2 7.39 39.89 47 0.97 490.7 7.45 39.86 48 2.39 480.3 7.44 39.87 49 1.66 477.3 7.44 39.87 50 3.36 493.4 7.37 39.72 51 4.88 465.4 7.44 39.84 52 3.40 465.2 7.4 39.86 53 4.46 439.8 7.4 39.82 54 2.99 4748 7.4 39.82 55 3.45 488.2 7.39 39.79 56 0.46 501.8 7.39 39.89 57 3.17 491.5 7.4 39.93 58 1.33 542.8 7.41 39.71 59 1.56 492.6 7.4 39.72 60 7.36 512.9 7.39 39.78 61 3.40 503.9 7.39 39.83 62 0.92 473.8 7.41 39.82
Step by Step Solution
There are 3 Steps involved in it

Get step-by-step solutions from verified subject matter experts