

Question: Had trouble fixing the errors below! Problem 18-03A a Your answer is partially correct. Try again. Condensed balance sheet and income statement data for Jergan
Had trouble fixing the errors below!
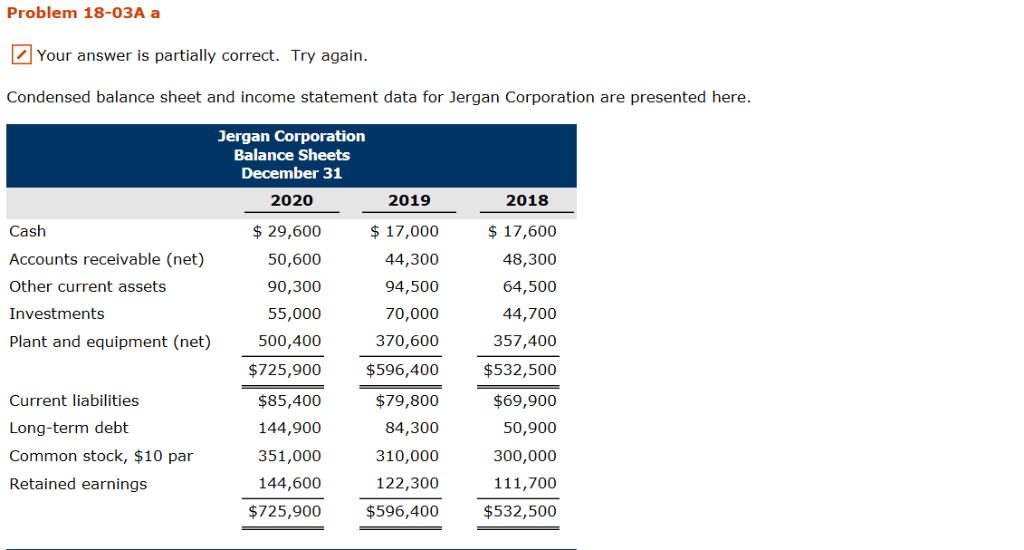
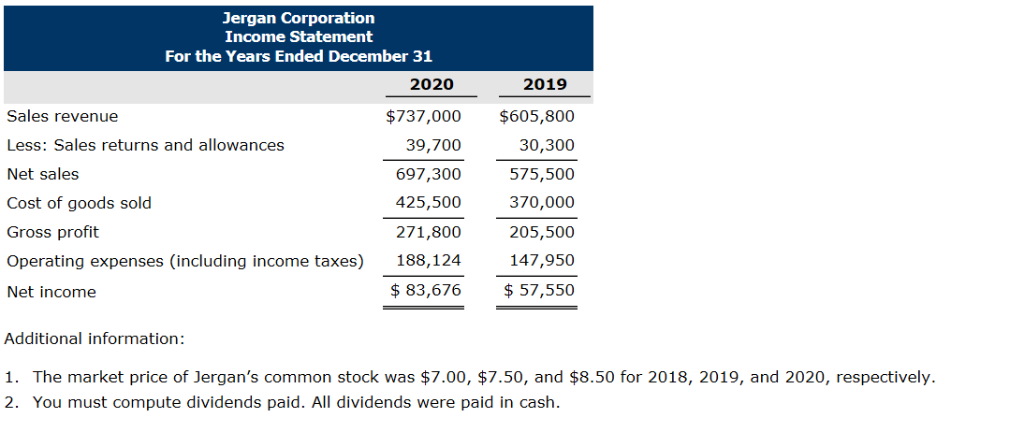
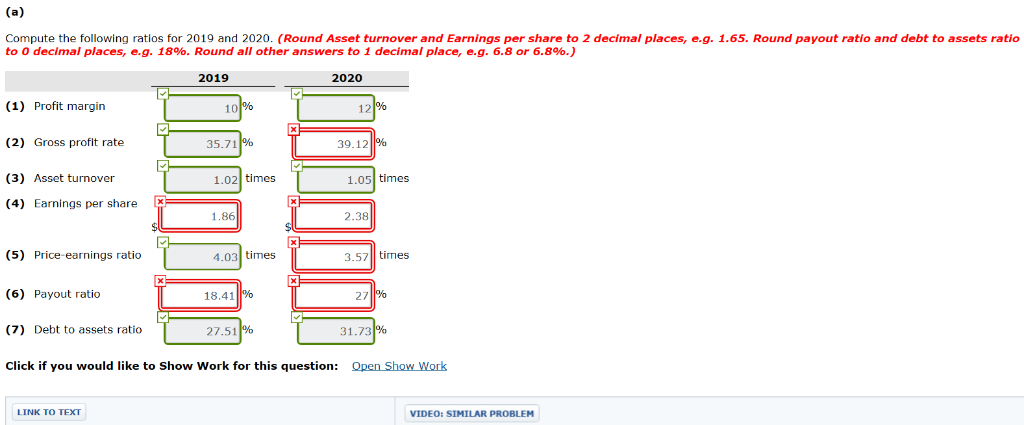
Problem 18-03A a Your answer is partially correct. Try again. Condensed balance sheet and income statement data for Jergan Corporation are presented here. Jergan Corporation Balance Sheets December 31 2020 2018 2019 29,600 $17,000 Cash $17,600 Accounts receivable (net) 50,600 48,300 44,300 Other current assets 90,300 94,500 64,500 Investments 55,000 70,000 44,700 Plant and equipment (net) 370,600 500,400 357,400 $725,900 $596,400 $532,500 Current liabilities $85,400 $79,800 $69,900 144,900 84,300 50,900 Long-term debt Common stock, $10 par 310,000 351,000 300,000 Retained earnings 144,600 122,300 111,700 $725,900 $596,400 $532,500 Jergan Corporation Income Statement For the Years Ended December 31 2020 2019 Sales revenue $737,000 $605,800 Less: Sales returns and allowances 39,700 30,300 697,300 Net sales 575,500 370,000 Cost of goods sold 425,500 Gross profit 271,800 205,500 147,950 Operating expenses (including income taxes) 188,124 83,676 57,550 Net income Additional information: 1. The market price of Jergan's common stock was $7.00, $7.50, and $8.50 for 2018, 2019, and 2020, respectively. 2. You must compute dividends paid. All dividends were paid in cash (a) Compute the following ratios for 2019 and 2020. (Round Asset turnover and Earnings per share to 2 decimal places, e.g. 1.65. Round payout ratio and debt to assets ratio to 0 decimal places, e.g. 18%. Round all other answers to 1 decimal place, e.g. 6.8 or 6.8%.) 2019 2020 (1) Profit margin 10% 12 39 12 % 35.71 % (2) Gross profit rate (3) Asset turnover 1.02 times 1.05 times (4) Earnings per share 1.86 2.38 (5) Price-earnings ratio times 4.03 times 3.57 (6) Payout ratio 18.41% 27 % 27.51 % 31.73% (7) Debt to assets ratio Open Show Work Click if you would like to Show Work for this question: LINK TO TEXT VIDEO: STMILAR
Step by Step Solution
There are 3 Steps involved in it

Get step-by-step solutions from verified subject matter experts