

Question: hah - COVID-19 VACCINATION CHALLENGE A Process Flow View ___ By Tinglong Dai and Jeannette Song By January 15, 2021, one month after the beginning
 hah
hah
-
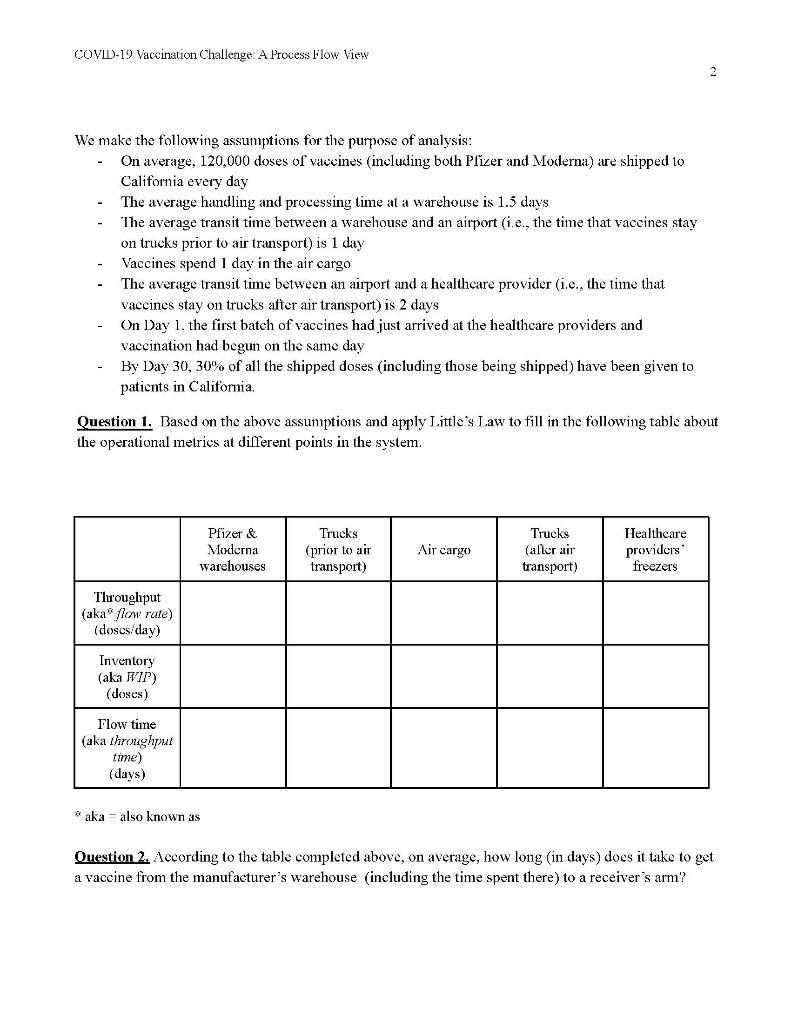
COVID-19 VACCINATION CHALLENGE A Process Flow View ___ By Tinglong Dai and Jeannette Song By January 15, 2021, one month after the beginning of the COVID-19 vaccination, the State of California had only administered 30% of its available doses, and was ranked the No. 2 worst-performing state in the United States in terms of the percentage of doses that are used (which, by the logic of Littles Law, measures the timeliness in getting the vaccine to the receivers). What contributes to this poor performance? In order to speed things up, where should the government put more resources to and/or provide more incentives? To gain insights, let us take a process flow view of the vaccine distribution system. This is a useful tool to help identify the bottleneck in the system. Below is a process flow chart of the vaccine distribution process.
the first figure is COVID-19 Vaccine Distribution Process Flow This case was developed by Tinglong Dai (Johns Hopkins University) and Jeannette Song (Duke University) for classroom discussions on Process Analysis, a topic typically covered in a graduate or undergraduate business course on Operations Management. Tinglong Dai Jeannette Song. This version: January 18, 2021.
Now
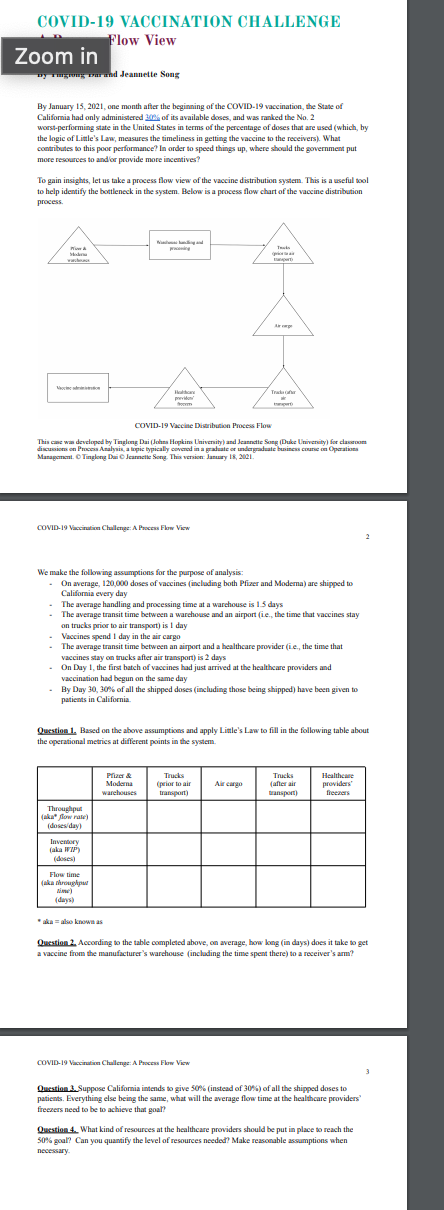
On average, 120,000 doses of vaccines (including both Pfizer and Moderna) are shipped to California every day - The average handling and processing time at a warehouse is 1.5 days - The average transit time between a warehouse and an airport (i.e., the time that vaccines stay on trucks prior to air transport) is 1 day - Vaccines spend 1 day in the air cargo - The average transit time between an airport and a healthcare provider (i.e., the time that vaccines stay on trucks after air transport) is 2 days - On Day 1, the first batch of vaccines had just arrived at the healthcare providers and vaccination had begun on the same day - By Day 30, 30% of all the shipped doses (including those being shipped) have been given to patients in California.
Question 1. Based on the above assumptions and apply Littles Law to fill in the following table about the operational metrics at different points in the system.
* aka = also known as Question 2. According to the table completed above, on average, how long (in days) does it take to get a vaccine from the manufacturers warehouse (including the time spent there) to a receivers arm?
COVID-19 Vaccination Challenge: A Process Flow View Question 3. Suppose California intends to give 50% (instead of 30%) of all the shipped doses to patients. Everything else being the same, what will the average flow time at the healthcare providers freezers need to be to achieve that goal? Question 4. What kind of resources at the healthcare providers should be put in place to reach the 50% goal? Can you quantify the level of resources needed? Make reasonable assumptions when necessary.
COVID-19 Vaccination Challenge A Process Flow View We make the following assumptions for the purpose of analysis: On average, 120,000 doses of vaccines (including both Plizer and Moderna) are shipped 10 California every day The average handling and processing time at a warehouse is 1.5 days The average transit time between a warehouse and an airport (i.e., the time that vaccines stay on trucks prior to air transport) is 1 day Vaccines spend 1 day in the air cargo The average transit time between an airport and a healthcare provider (i.e., the time that vaccines stay on trucks after air transport) is 2 days On Day 1. the first batch of vaccines had just arrived at the healthcare providers and vaccination had begun on the same day By Day 30, 30% of all the shipped doses (including those being shipped) have been given to patients in California Question 1. Based on the above assumptions and apply Little's Law to fill in the following table about the operational metrics at different points in the system. Pfizer & Moderna warehouses Trucks (prior to air transport) Air cargo Trucks (aller air transport) Healthcare providers freezers Throughput (aka" low rate) (dosesday) Inventory (aka WIP) (doses) Flow time (aka throughout time) (days) aka - also known as Question 2. According to the table completed above, on average, how long (in days) does it take to get a vaccine from the manufacturer's warehouse (including the time spent there) to a receiver's arm? COVID-19 VACCINATION CHALLENGE Flow View Zoom in as and Jeannette Song By January 15, 2021, one month after the beginning of the COVID-19 vaccination, the State of California had only administered 30% of its available deses, and was ranked the No. 2 worst-performing state in the United States in terms of the percentage of doses that are used (which, by the logic of Little's Law, measures the timeliness in getting the vaccine to the receivers). What contributes to this poor performance? In order to speed things up, where should the government put more resources to and for provide more incentives? To gain insights, let us take a process flow view of the vaccine distribution system. This is a useful tool to help identify the bottleneck in the system. Below is a process flow chart of the vaccine distribution process Trac po COVID-19 Vaccine Distribution Process Flow This come was developed by Tinglong Dai Jolana Hopkins University) and Jeanni Song (Duke University) for cam discussion Process Analysis a pic typically covered in a graduate or undergraduate business course on Operations Management. Tinglong Di Jamil Song. This version: Jamry 18, 2021 COVID-19 Vacciata Chillenge: A Process Flow View We make the following assumptions for the purpose of analysis. On average, 120,000 doses of vaccines (including both Pfizer and Modema) are shipped to California every day The average handling and processing time at a warehouse is 1.5 days The average transit time between a warehouse and an airport (ie, the time that vaccines stay on trucks prior to air transport)is 1 day Vaccines spend 1 day in the air cargo The average transit time between an airport and a healthcare provider (ie., the time that vaccines stay on trucks after air transport) is 2 days On Day 1, the first batch of vaccines had just arrived at the healthcare providers and Vaccination had begun on the same day - By Day 30, 30% of all the shipped doses (including those being shipped) have been given to patients in California Question 1. Based on the above assumptions and apply Little's Law to fill in the following table about the operational metrics at different points in the system Pri Moderna warehouse (prior to air transport) Air cargo Tracks (after air transport) Healthcare providers theers Throughout (aka flow rate) (doses/day) Inventory (dasics) ( ) Flowtime a usualpet dows) Question 2. According to the table completed above, on average, how long (in days) does it take to get a vaccine from the manufacturer's warehouse (including the time spent there) to a receiver's arm? COVID-19 Vaccia Chillenge: A Process Flow View Question 3. Suppose California intends to give 50% (instead of 30%) of all the shipped doses to patients. Everything else being the same, what will the average flow time at the healthcare providers fireezers need to be to achieve that goal! Question 4. What kind of resources at the healthcare providers should be put in place to reach the 50% goal? Can you quantify the level of resources needed? Make reasonable assumptions when necessary
Step by Step Solution
There are 3 Steps involved in it

Get step-by-step solutions from verified subject matter experts