

Question: Hampton Machine Tool. Co lected statistics: December 1978 to August 19 Eight Months December-78 Ending 8/31/79 Exhibit 2 Balance Sheets 1978-1979 (thousands of dollars) 1978
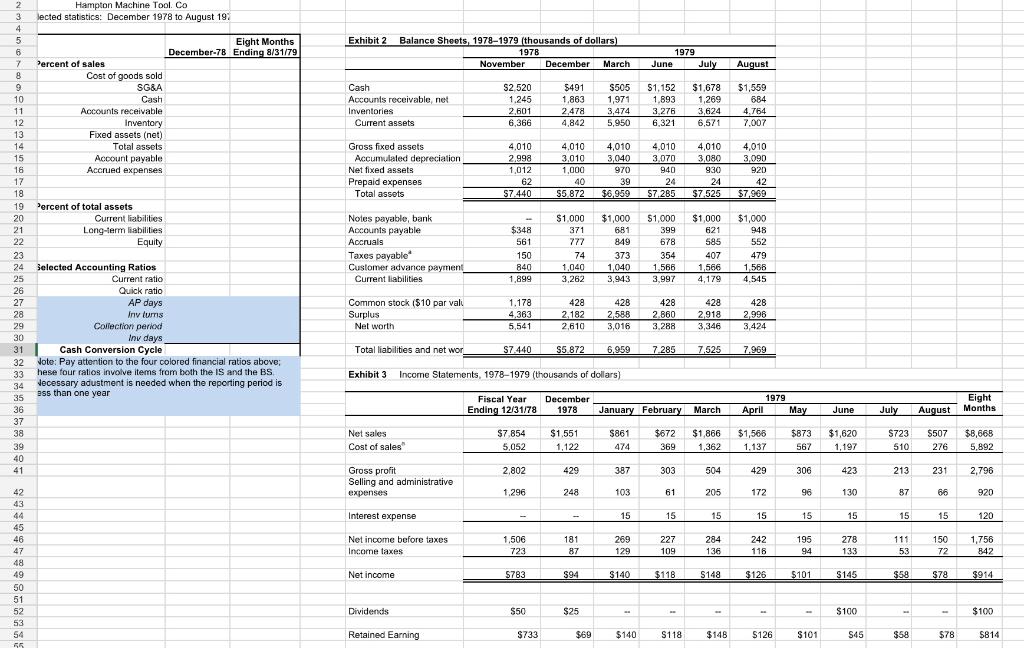
Hampton Machine Tool. Co lected statistics: December 1978 to August 19 Eight Months December-78 Ending 8/31/79 Exhibit 2 Balance Sheets 1978-1979 (thousands of dollars) 1978 November December March 1979 June July August Percent of sales Cost of goods sold SG&A Cash Accounts receivable Inventory Fixed assets (net) Total assets Account payable Accrued expenses Cash Accounts receivable, net Inventories Current assets $2.520 1.245 2,601 6,366 5491 1,863 2,478 4,842 $505 1,971 3,474 5,950 $1,152 1,893 3,276 6,321 $1,678 1,269 3,624 6.571 $1,559 684 4,764 7.007 Gross fixed assets Accumulated depreciation Net fixed assets Prepaid expenses Total assets 4,010 2.998 1,012 62 S7.440 4,010 3,010 1,000 40 $5.872 4,010 3,040 970 39 $6.959 4,010 4,010 4,010 3,070 3,080 3,090 940 930 920 24 24 42 $7,285 $7,525 $7.969 2 3 4 4 5 6 7 8 9 10 11 12 13 14 15 16 17 18 19 20 21 22 23 24 25 26 27 28 29 30 31 32 33 34 35 36 37 38 39 40 41 Percent of total assets Current liabilities Long-term liabilities Equity $1.000 371 777 Noles payable, bank Accounts payable Accruals Taxes payable Customer advance payment Current liabilities $348 561 150 840 1,899 $1,000 681 849 373 1,040 3,943 $1,000 399 678 354 1,566 3,997 $1.000 621 585 407 1.566 4.179 $1,000 948 552 479 1,568 4.545 74 1,040 3,262 Common stock ($10 par valu Surplus Net worth 1,178 4363 5,541 428 2,182 2,610 428 2,588 3,016 428 2.860 3.288 428 2,918 3,346 Selected Accounting Ratios Current ratio Quick ratio AP days iny turns Collection period Inv days Cash Conversion Cycle Note: Pay attention to the four colored financial ratios above; hese four ratios involve items from both the IS and the BS Necessary adustment is needed when the reporting period is ass than one year 428 2,996 3,424 Total liabilities and not wor S7.440 S5.872 6,959 7.285 7.525 7,969 Exhibit 3 Income Statements, 1978-1979 (thousands of dollars) Fiscal Year Ending 12/31/78 December 1978 1979 April May Eight Months January February March June July August $8.668 Net sales Cost of sales $7854 5,052 $1,551 1,122 $861 474 $672 369 $1 866 1,362 $1,566 $ 1.137 $873 567 $1,620 1,197 $723 510 $507 276 5,892 2,802 429 387 303 504 429 306 423 213 231 2,796 Gross profit Selling and administrative expenses 1.296 248 103 61 205 172 96 130 87 66 920 Interest expense 15 15 15 15 15 15 15 15 120 Net income before taxes Incorne taxes 1,506 723 181 87 269 129 227 109 284 136 242 116 195 94 278 133 111 53 150 72 1,756 842 42 43 44 45 46 47 48 49 50 51 52 53 54 55 Net Income S783 S94 $140 $118 S148 $126 $101 $ $145 $58 $78 $914 Dividends $50 $25 - $100 $100 Retained Earning $733 $69 $140 S118 $148 $126 S101 S45 $58 $78 $814
Step by Step Solution
There are 3 Steps involved in it

Get step-by-step solutions from verified subject matter experts