

Question: Hands on with the data For this exercise you will use a subset of the data for Assignment 2. Take the three largest companies and
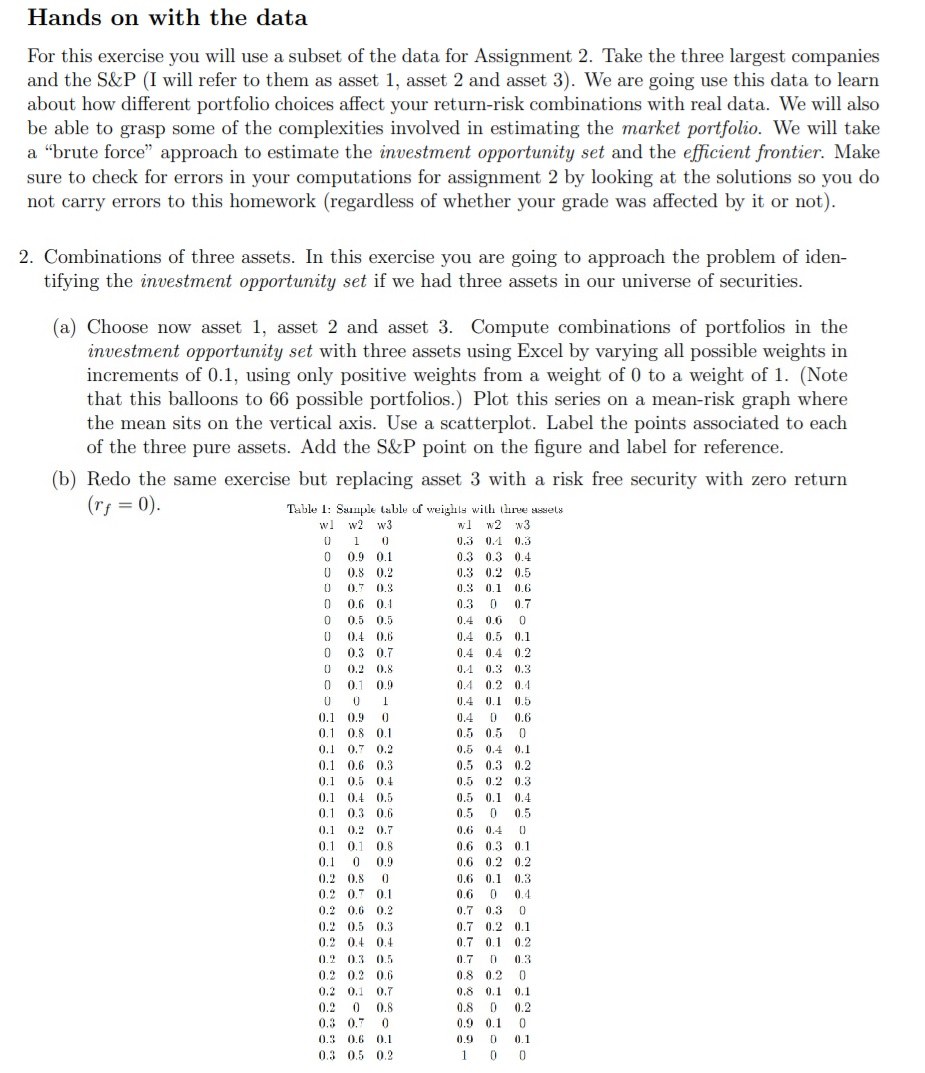
Hands on with the data For this exercise you will use a subset of the data for Assignment 2. Take the three largest companies and the S&P (I will refer to them as asset 1, asset 2 and asset 3). We are going use this data to learn about how different portfolio choices affect your return-risk combinations with real data. We will also be able to grasp some of the complexities involved in estimating the market portfolio. We will take a "brute force approach to estimate the investment opportunity set and the efficient frontier. Make sure to check for errors in your computations for assignment 2 by looking at the solutions so you do not carry errors to this homework (regardless of whether your grade was affected by it or not). 2. Combinations of three assets. In this exercise you are going to approach the problem of iden- tifying the investment opportunity set if we had three assets in our universe of securities. (a) Choose now asset 1, asset 2 and asset 3. Compute combinations of portfolios in the investment opportunity set with three assets using Excel by varying all possible weights in increments of 0.1, using only positive weights from a weight of 0 to a weight of 1. (Note that this balloons to 66 possible portfolios.) Plot this series on a mean-risk graph where the mean sits on the vertical axis. Use a scatterplot. Label the points associated to each of the three pure assets. Add the S&P point on the figure and label for reference. (b) Redo the same exercise but replacing asset 3 with a risk free security with zero return (ry=0). Table 1: Sample table of weights with three el! wl w2w3 wl w2w3 0 1 0 0.3 0.1 0.3 0 0.9 0.1 0.3 0.3 0.4 0 0.8 0.2 0.3 0.2 0.5 0 0.7 0.3 0.3 0.1 0.6 0 0.6 0.1 0. 30 0.7 0 0.5 0.5 0.4 0.6 0 0 0.4 0.6 0.4 0.5 0.1 0 0.3 0.7 0.4 0.4 0.2 0 0.2 0.8 0.4 0.3 0.3 0 0.1 0.9 0.4 0.2 0.4 0 0 1 0.4 0.1 0.5 0.1 0.9 0. 0.4 0 0.6 0.1 0.8 0.1 0.5 0.5 0 0.1 0.7 0.2 0.5 0.4 0.1 0.1 0.6 0.3 0.5 0.3 0.2 0.1 0.5 0.4 0.5 0.2 0.3 0.1 0.4 0.5 0.5 0.1 0.4 0.1 0.3 0.6 0. 50 0.5 0.1 0.2 0.7 0.6 0.4 0 0.1 0.1 0.8 0.6 0.3 0.1 0. 10 0.9 0.6 0.2 0.2 0.2 0.8 0 0.6 0.1 0.3 0.2 0.7 0.1 0.6 0 0.4 0.2 0.6 0.2 0.7 0.3 0 0.2 0.5 0.3 0.7 0.2 0.1 0.2 0.4 0.4 0.7 0.1 0.2 0.2 0.3 0.5 0.7 D03 0.2 0.2 0.6 0.8 0.2 0 0.2 0.1 0.7 0.8 0.1 0.1 0. 2 0 0.8 0.8 0 0.2 0.3 0.7 0 0.9 0.1 0 0.3 0.6 0.1 0.9 D 0.1 0.3 0.5 0.2 1 0 0 Hands on with the data For this exercise you will use a subset of the data for Assignment 2. Take the three largest companies and the S&P (I will refer to them as asset 1, asset 2 and asset 3). We are going use this data to learn about how different portfolio choices affect your return-risk combinations with real data. We will also be able to grasp some of the complexities involved in estimating the market portfolio. We will take a "brute force approach to estimate the investment opportunity set and the efficient frontier. Make sure to check for errors in your computations for assignment 2 by looking at the solutions so you do not carry errors to this homework (regardless of whether your grade was affected by it or not). 2. Combinations of three assets. In this exercise you are going to approach the problem of iden- tifying the investment opportunity set if we had three assets in our universe of securities. (a) Choose now asset 1, asset 2 and asset 3. Compute combinations of portfolios in the investment opportunity set with three assets using Excel by varying all possible weights in increments of 0.1, using only positive weights from a weight of 0 to a weight of 1. (Note that this balloons to 66 possible portfolios.) Plot this series on a mean-risk graph where the mean sits on the vertical axis. Use a scatterplot. Label the points associated to each of the three pure assets. Add the S&P point on the figure and label for reference. (b) Redo the same exercise but replacing asset 3 with a risk free security with zero return (ry=0). Table 1: Sample table of weights with three el! wl w2w3 wl w2w3 0 1 0 0.3 0.1 0.3 0 0.9 0.1 0.3 0.3 0.4 0 0.8 0.2 0.3 0.2 0.5 0 0.7 0.3 0.3 0.1 0.6 0 0.6 0.1 0. 30 0.7 0 0.5 0.5 0.4 0.6 0 0 0.4 0.6 0.4 0.5 0.1 0 0.3 0.7 0.4 0.4 0.2 0 0.2 0.8 0.4 0.3 0.3 0 0.1 0.9 0.4 0.2 0.4 0 0 1 0.4 0.1 0.5 0.1 0.9 0. 0.4 0 0.6 0.1 0.8 0.1 0.5 0.5 0 0.1 0.7 0.2 0.5 0.4 0.1 0.1 0.6 0.3 0.5 0.3 0.2 0.1 0.5 0.4 0.5 0.2 0.3 0.1 0.4 0.5 0.5 0.1 0.4 0.1 0.3 0.6 0. 50 0.5 0.1 0.2 0.7 0.6 0.4 0 0.1 0.1 0.8 0.6 0.3 0.1 0. 10 0.9 0.6 0.2 0.2 0.2 0.8 0 0.6 0.1 0.3 0.2 0.7 0.1 0.6 0 0.4 0.2 0.6 0.2 0.7 0.3 0 0.2 0.5 0.3 0.7 0.2 0.1 0.2 0.4 0.4 0.7 0.1 0.2 0.2 0.3 0.5 0.7 D03 0.2 0.2 0.6 0.8 0.2 0 0.2 0.1 0.7 0.8 0.1 0.1 0. 2 0 0.8 0.8 0 0.2 0.3 0.7 0 0.9 0.1 0 0.3 0.6 0.1 0.9 D 0.1 0.3 0.5 0.2 1 0 0
Step by Step Solution
There are 3 Steps involved in it

Get step-by-step solutions from verified subject matter experts