

Question: Handwritten solution not required correct answer will get instant upvote. 12. Elastic and inelastic supply The following graph plots a supply curve for some hypothetical
Handwritten solution not required correct answer will get instant upvote.

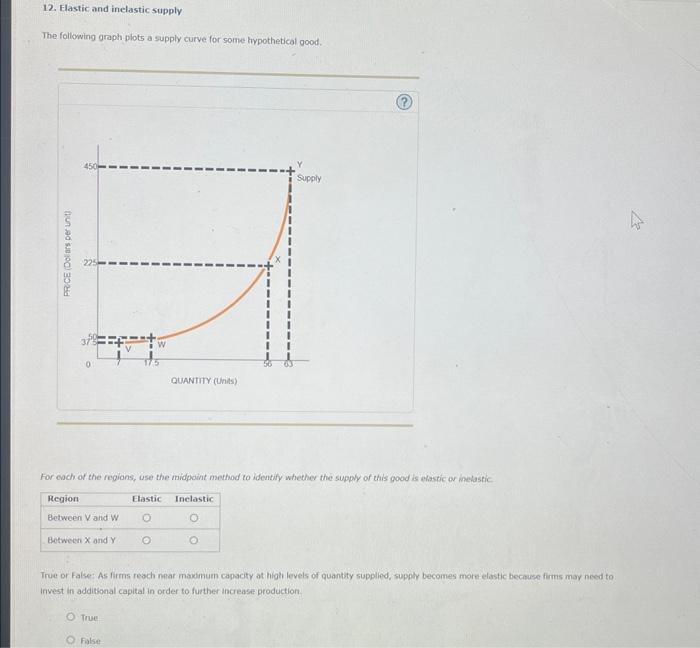
12. Elastic and inelastic supply The following graph plots a supply curve for some hypothetical good, (?) 450 Supply PRICE (Dollars per unit). 225 QUANTITY (Units) For each of the regions, use the midpoint method to identify whether the supply of this good is elastic or inelastic Region Elastic Inclastic Between V and W O Botween X and Y O O True or False: As firms reach near maximum capacity at high levels of quantity supplied, supply becomes more elastic because firms may need to Invest in additional capital in order to further increase production. O False
Step by Step Solution
There are 3 Steps involved in it
1 Expert Approved Answer
Step: 1 Unlock

Question Has Been Solved by an Expert!
Get step-by-step solutions from verified subject matter experts
Step: 2 Unlock
Step: 3 Unlock