

Question: HAPTER 7 HYPOTHESIS TESTI ONL 030.021 using the given sample statistics. State your decision for a = 0.01 levels of significance. If convenient, use
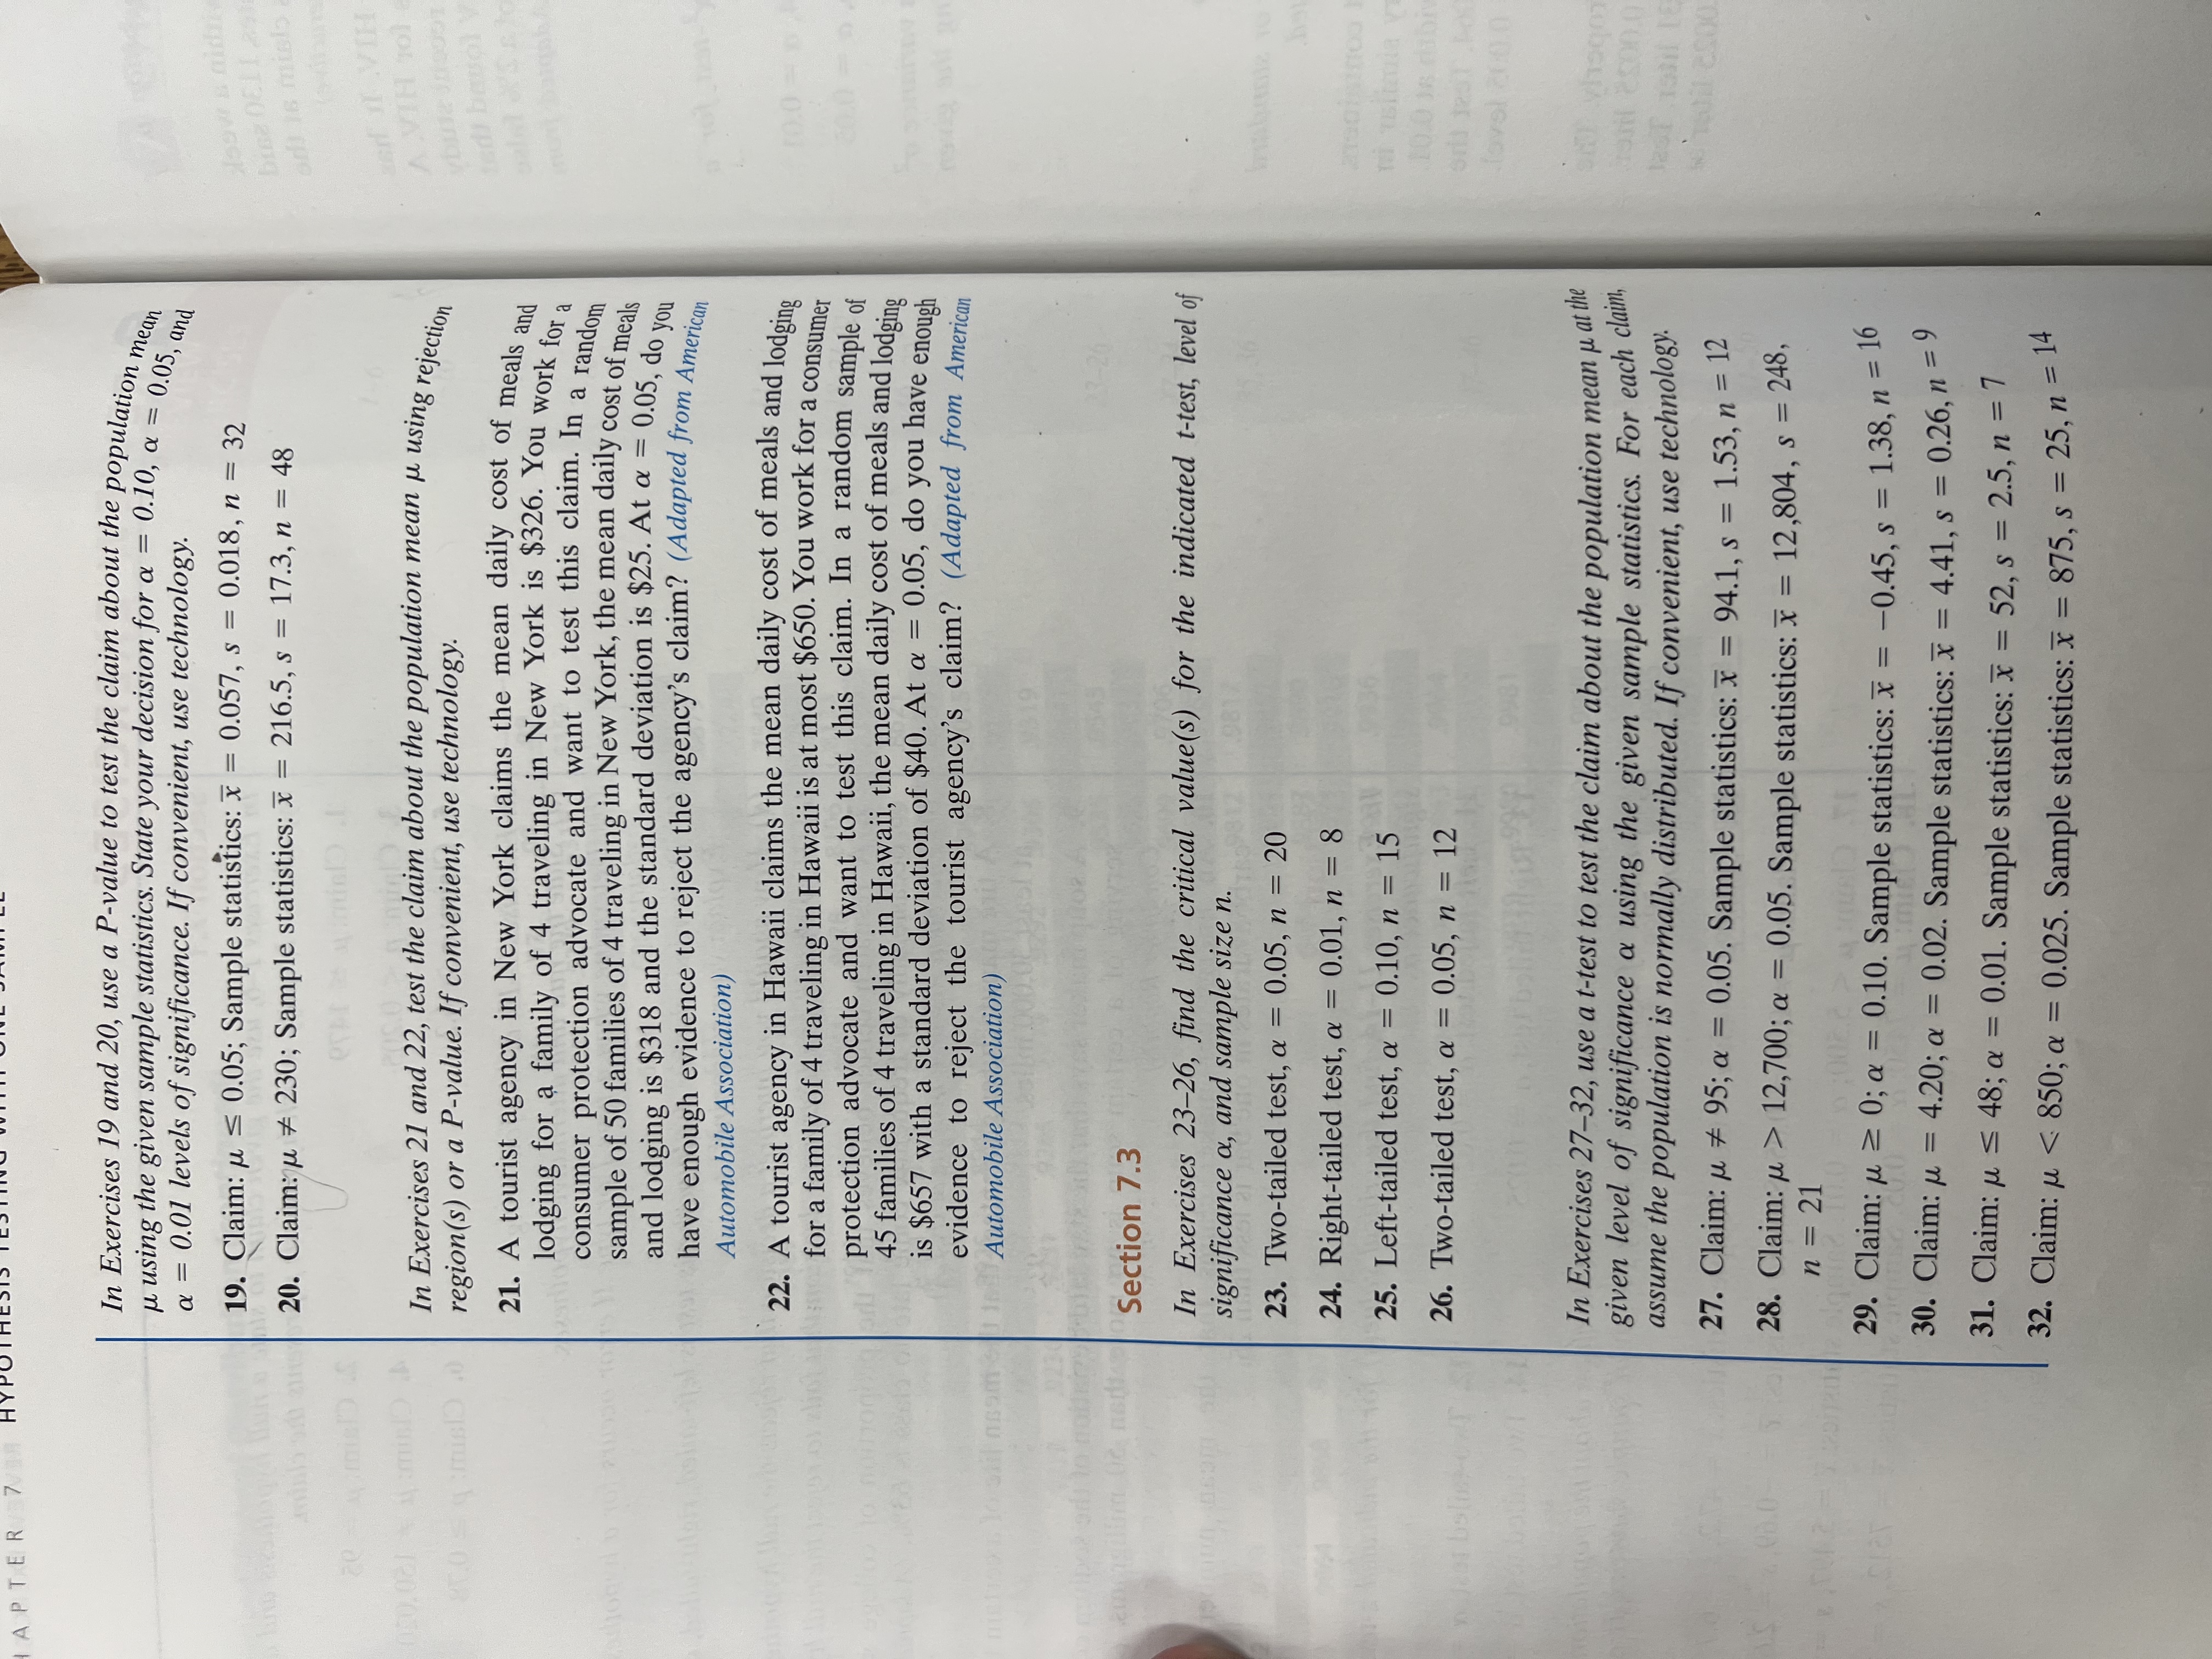
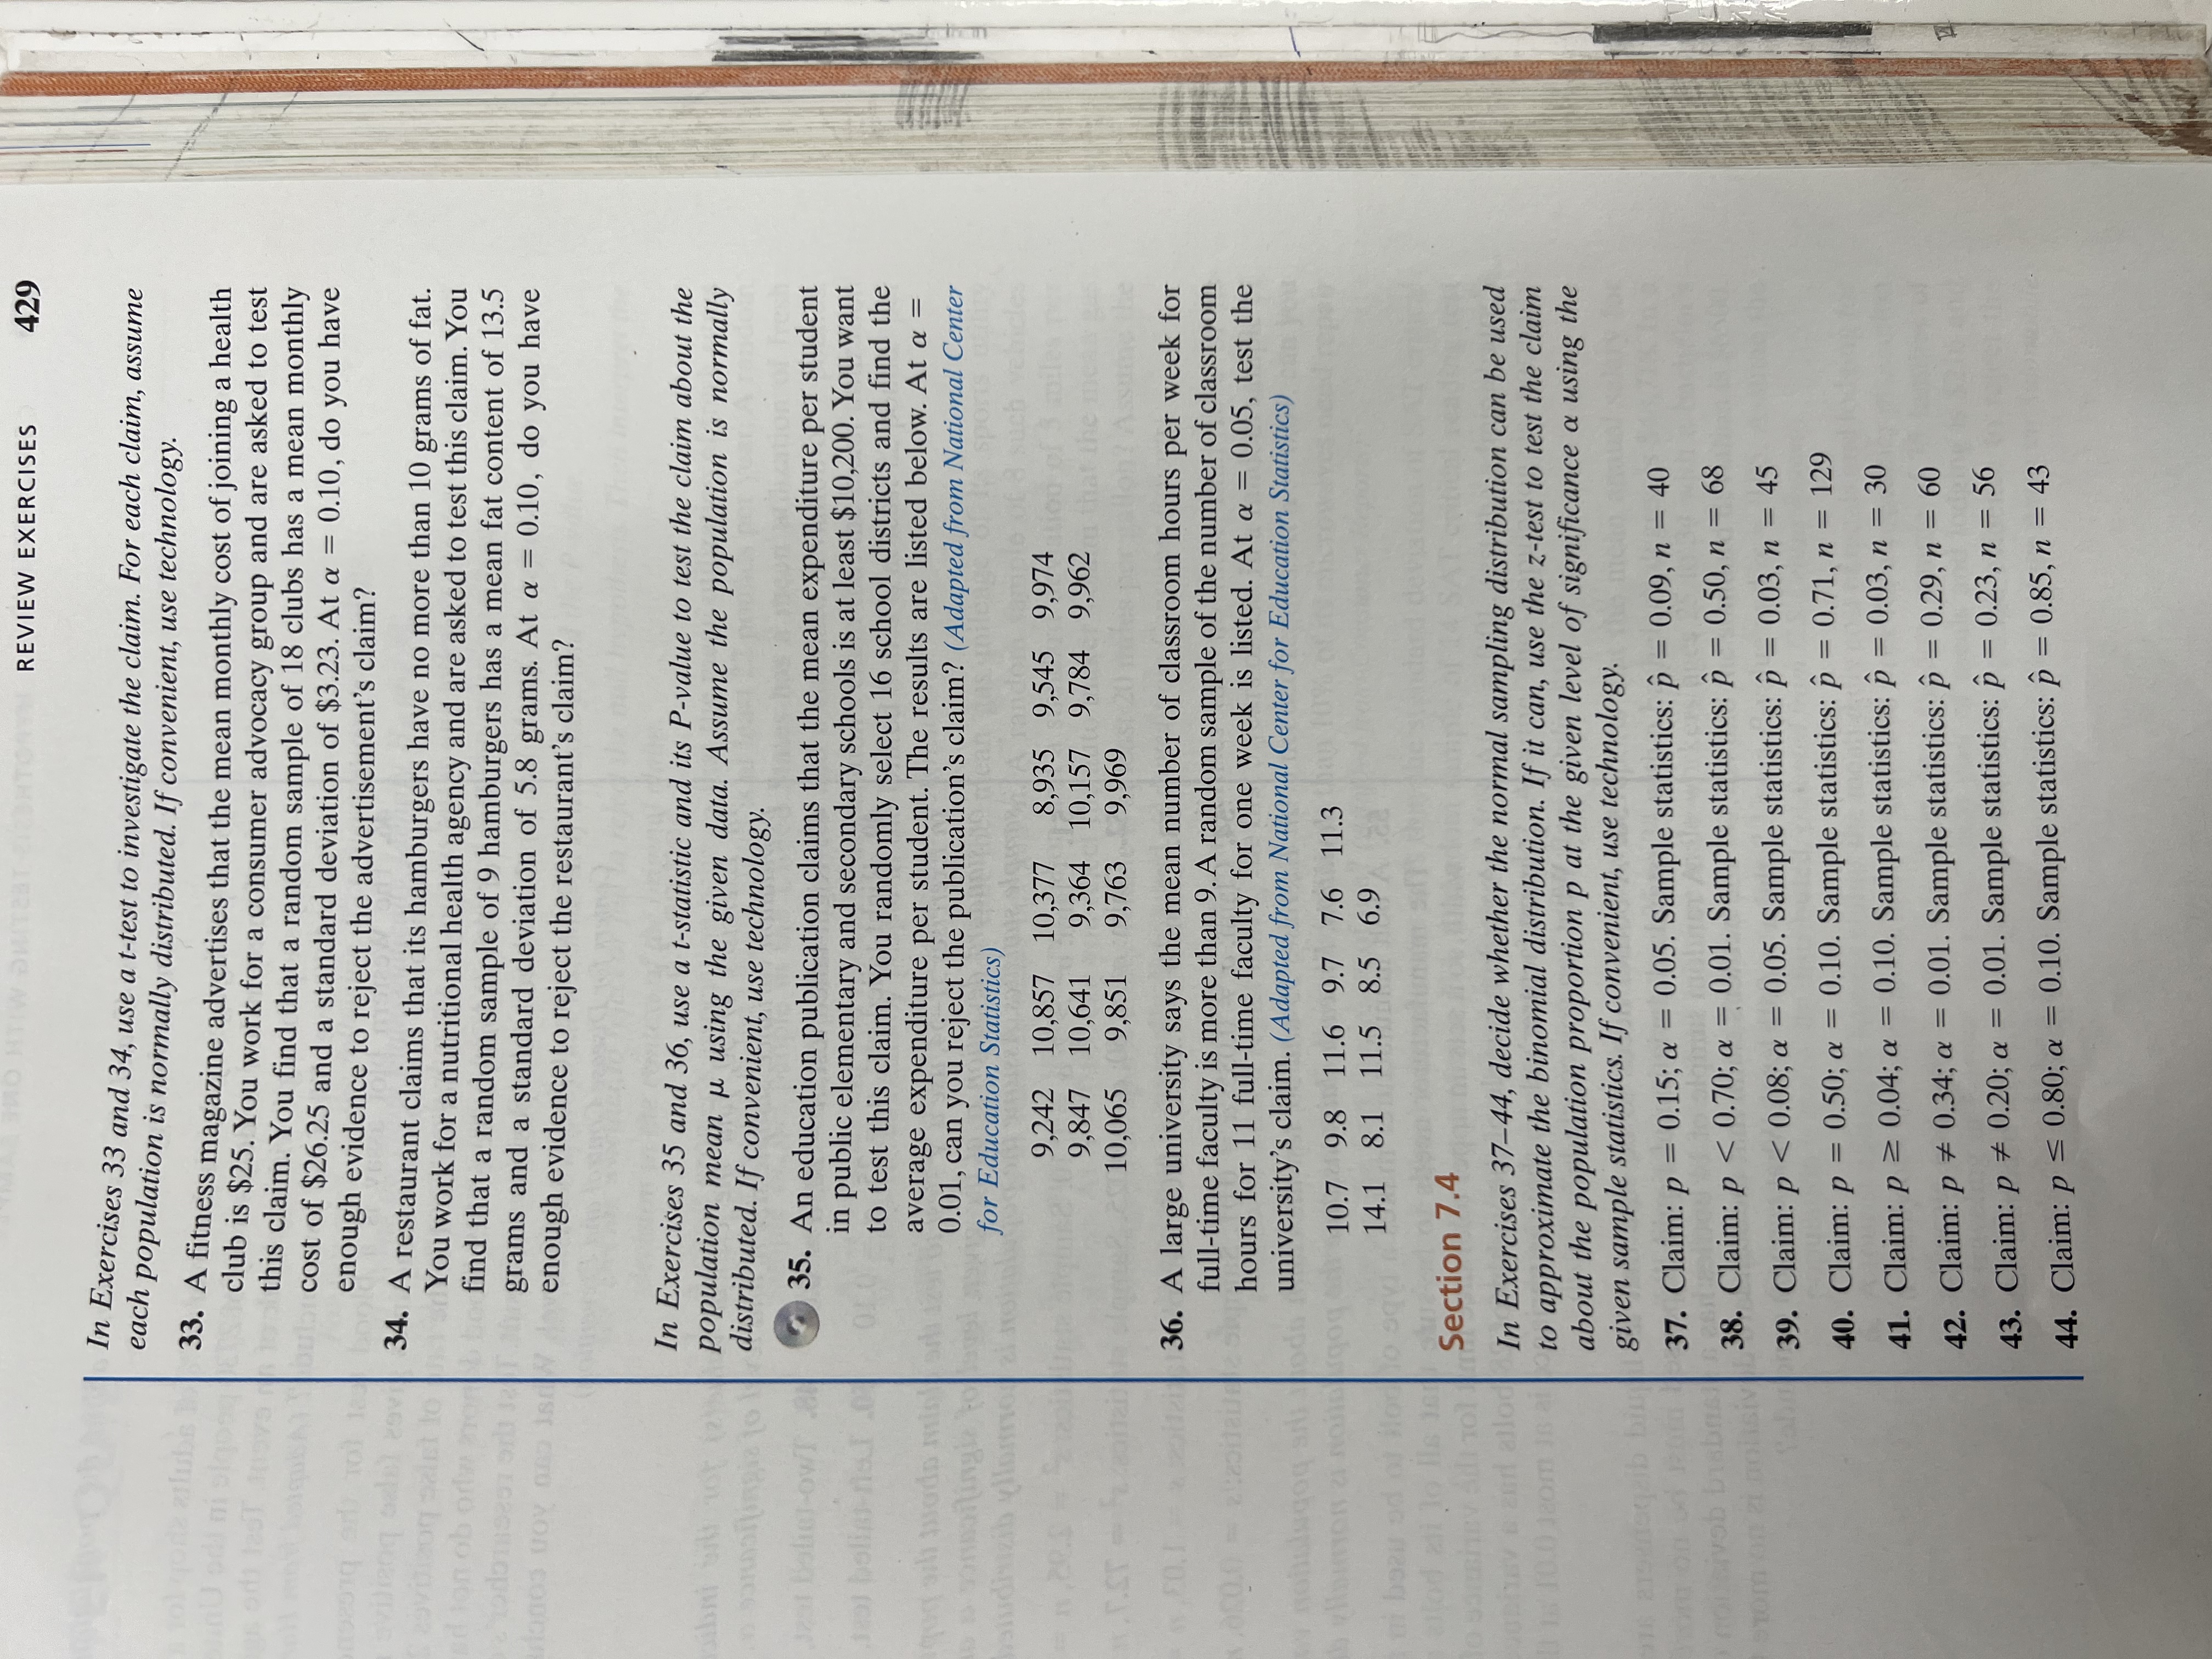
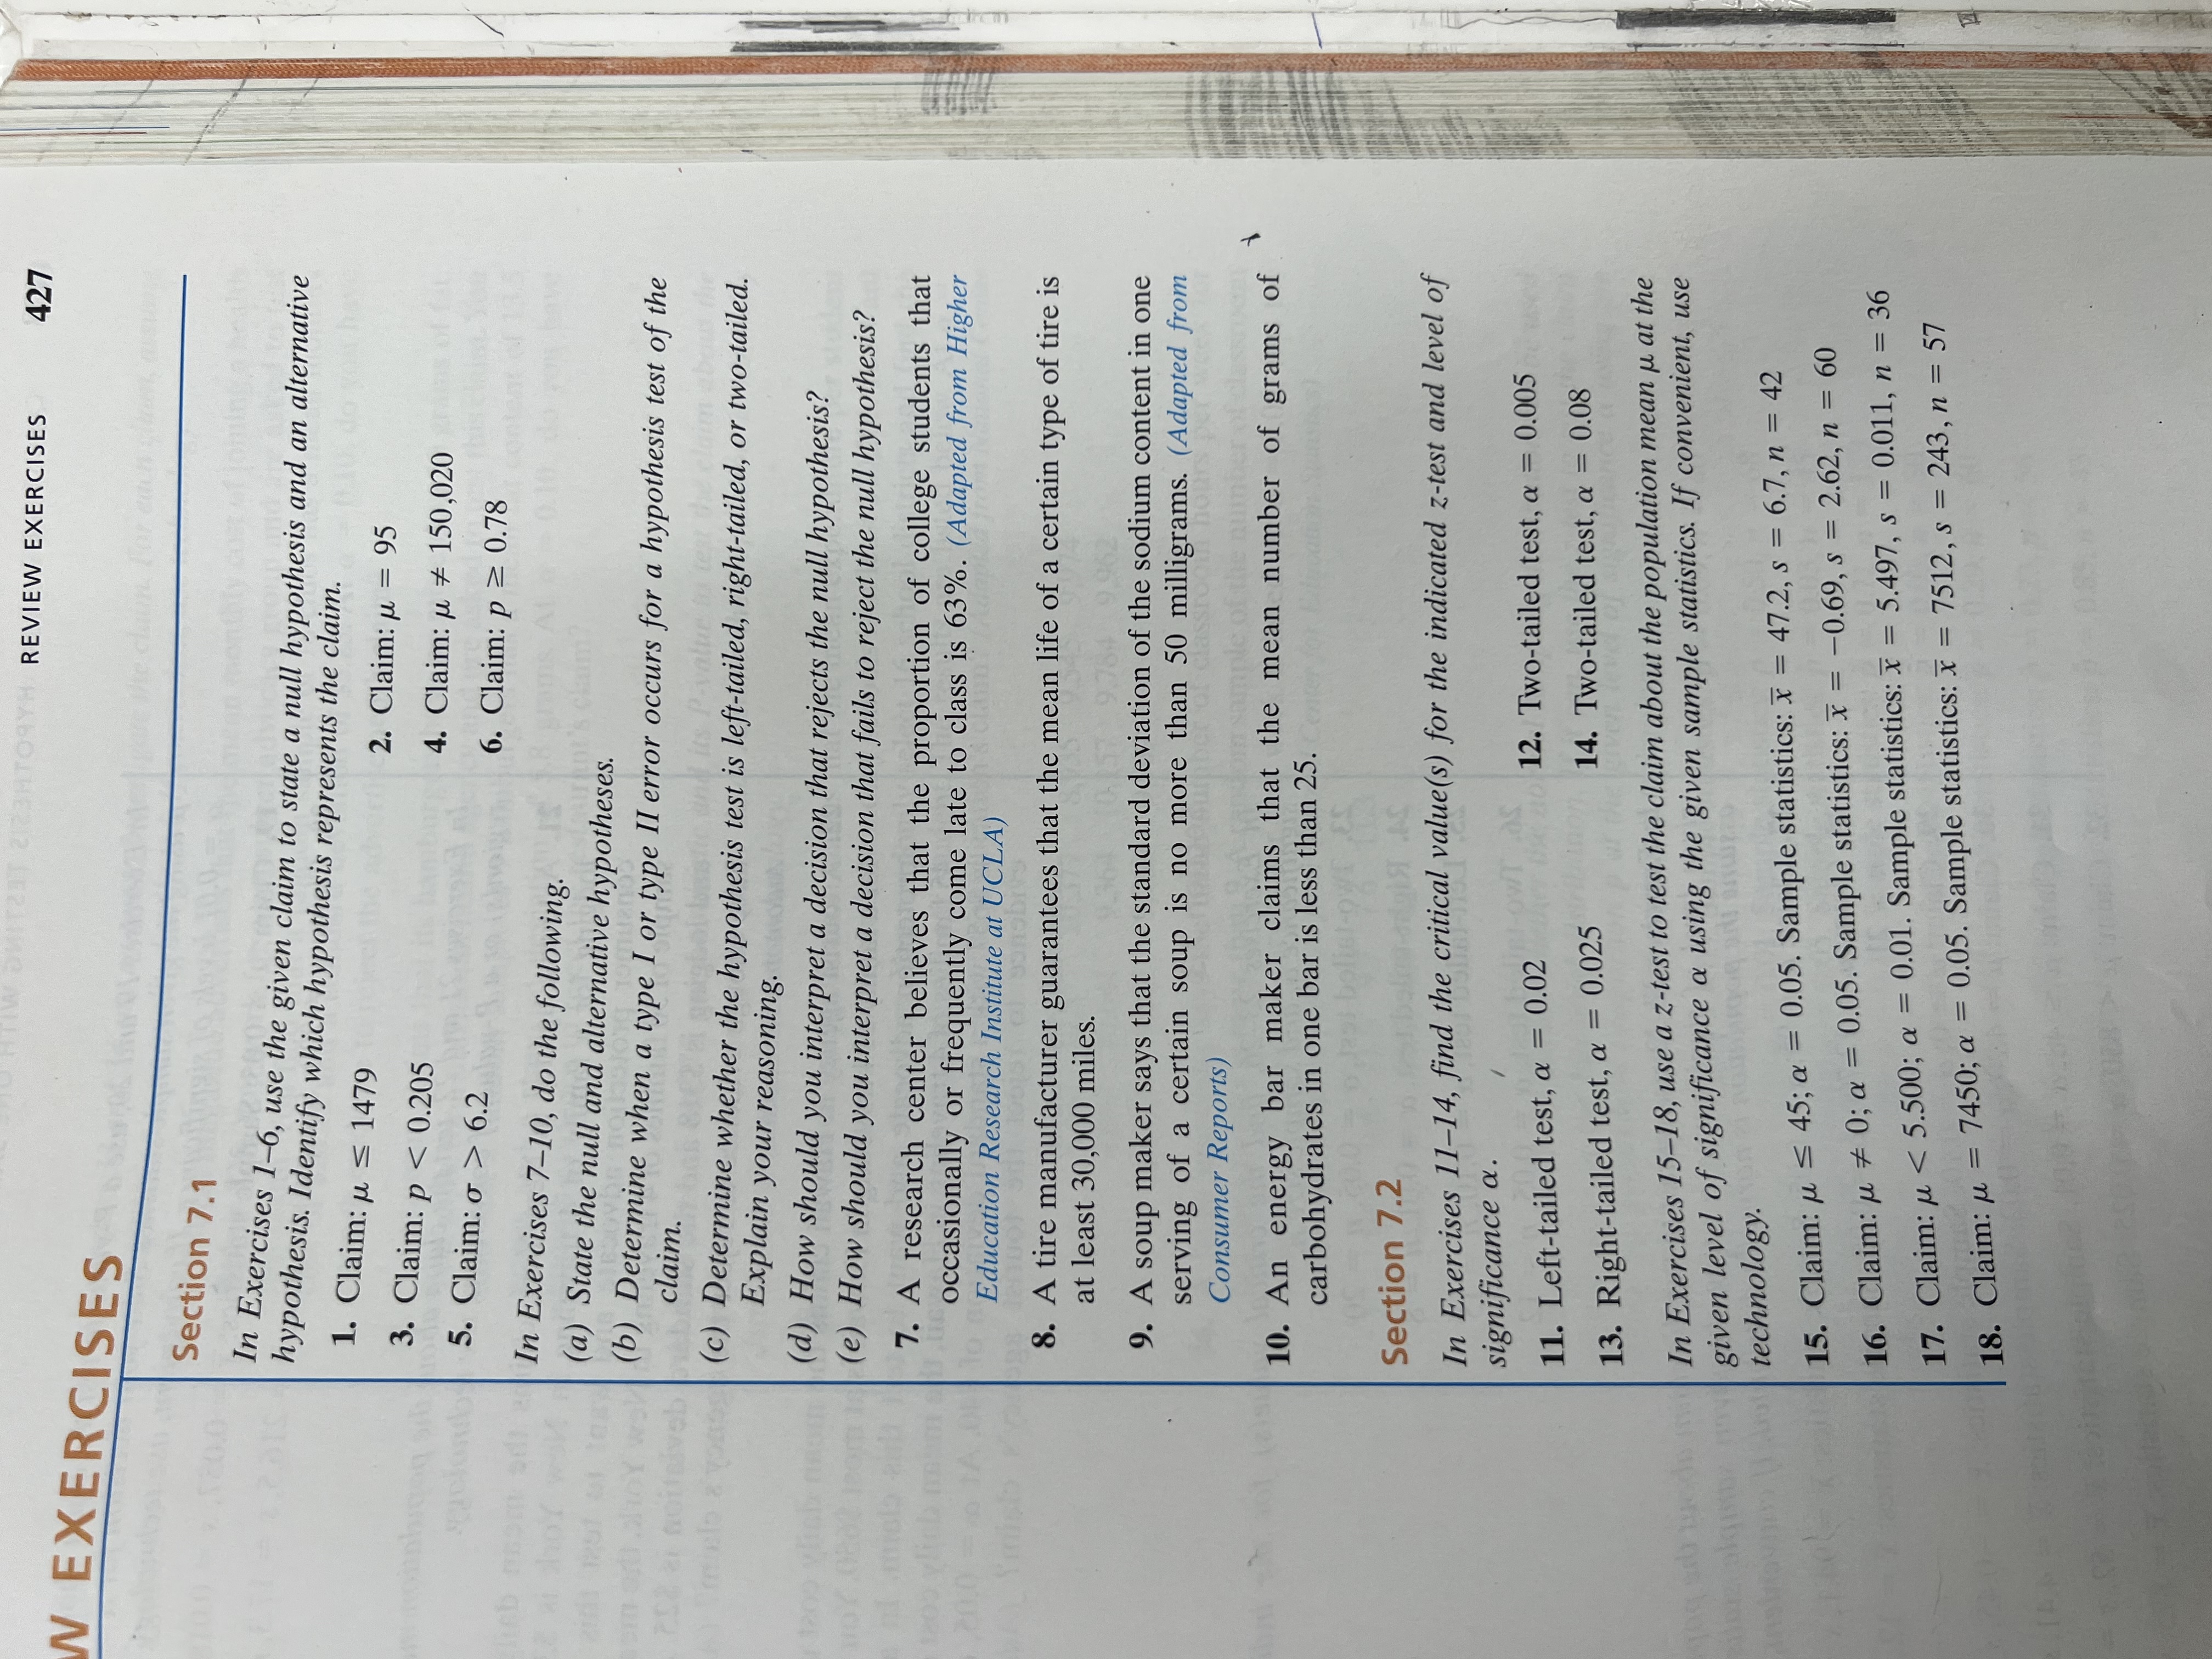
HAPTER 7 HYPOTHESIS TESTI ONL 030.021 using the given sample statistics. State your decision for a = 0.01 levels of significance. If convenient, use technology. In Exercises 19 and 20, use a P-value to test the claim about the population mean a = 19. Claim: 0.05; Sample statistics: X = 0.10, = = 0.05, and 0.057, s=0.018, n = 32 20. Claim: 230; Sample statistics: x = 216.5, s = 17.3, n = 48 In Exercises 21 and 22, test the claim about the population mean using rejection region(s) or a P-value. If convenient, use technology. 21. A tourist agency in New York claims the mean daily cost of meals and lodging for a family of 4 traveling in New York is $326. You work for a consumer protection advocate and want to test this claim. In a random sample of 50 families of 4 traveling in New York, the mean daily cost of meals and lodging is $318 and the standard deviation is $25. At a = 0.05, do you have enough evidence to reject the agency's claim? (Adapted from American Automobile Association) 22. A tourist agency in Hawaii claims the mean daily cost of meals and lodging for a family of 4 traveling in Hawaii is at most $650. You work for a consumer protection advocate and want to test this claim. In a random sample of 45 families of 4 traveling in Hawaii, the mean daily cost of meals and lodging is $657 with a standard deviation of $40. At a = 0.05, do you have enough evidence to reject the tourist agency's claim? (Adapted from American Automobile Association) bisz odi 16 VIH AVIH 101 sol V Section 7.3 In Exercises 23-26, find the critical value(s) for the indicated t-test, level of significance a, and sample size n. 23. Two-tailed test, a = 0.05, n = 20 24. Right-tailed test, a = 0.01, n = 8 25. Left-tailed test, a = 0.10, n = 15 26. Two-tailed test, a = 0.05, n = 12 bi foval 200.0 In Exercises 27-32, use a t-test to test the claim about the population mean at the given level of significance a using the given sample statistics. For each claim, assume the population is normally distributed. If convenient, use technology. 27. Claim: # 95; = 0.05. Sample statistics: = 94.1, s = 1.53, n = 12 28. Claim: > 12,700; = 0.05. Sample statistics: x = 12,804, s = 248, n = 21 29. Claim: 0; = 0.10. Sample statistics: x = a -0.45, s = 1.38, n = 16 30. Claim: = 4.20; a = 0.02. Sample statistics: x = 4.41, s = 0.26, n = 9 31. Claim: 48; = 0.01. Sample statistics: x = 52, s = 2.5, n = 1 32. Claim: 6.2 In Exercises 7-10, do the following. (a) State the null and alternative hypotheses. 2. Claim: = 95 4. Claim: # 150,020 6. Claim: p 0.78 (b) Determine when a type I or type II error occurs for a hypothesis test of the claim. P-value (c) Determine whether the hypothesis test is left-tailed, right-tailed, or two-tailed. Explain your reasoning. (d) How should you interpret a decision that rejects the null hypothesis? (e) How should you interpret a decision that fails to reject the null hypothesis? 7. A research center believes that the proportion of college students that occasionally or frequently come late to class is 63%. (Adapted from Higher Education Research Institute at UCLA) 93 8. A tire manufacturer guarantees that the mean life of a certain type of tire is at least 30,000 miles. 9. A soup maker says that the standard deviation of the sodium content in one serving of a certain soup is no more than 50 milligrams. (Adapted from Consumer Reports) 10. An energy bar maker claims that the mean number of grams of carbohydrates in one bar is less than 25. Section 7.2 In Exercises 11-14, find the critical value(s) for the indicated z-test and level of significance a. 11. Left-tailed test, a = 0.02 13. Right-tailed test, a = 0.025 12. Two-tailed test, a = 0.005 14. Two-tailed test, a = 0.08 In Exercises 15-18, use a z-test to test the claim about the population mean at the given level of significance a using the given sample statistics. If convenient, use technology. 15. Claim: 45; a = 0.05. Sample statistics: x = 47.2, s = 6.7, n = 42 16. Claim: = 0; = 0.05. Sample statistics: x = -0.69, s = 2.62, n = 60 # 17. Claim: < 5.500; a = 0.01. Sample statistics: x = 5.497, s = 0.011, n = 36 M 18. Claim: = 7450; = 0.05. Sample statistics: x = 7512, s = 243, n = 57 a 1
Step by Step Solution
There are 3 Steps involved in it

Get step-by-step solutions from verified subject matter experts