

Question: Have to use excel, pleas help me Homework #1 Read the data points from the given two graphs. Draw the scatter diagrams by using Excel.
Have to use excel, pleas help me
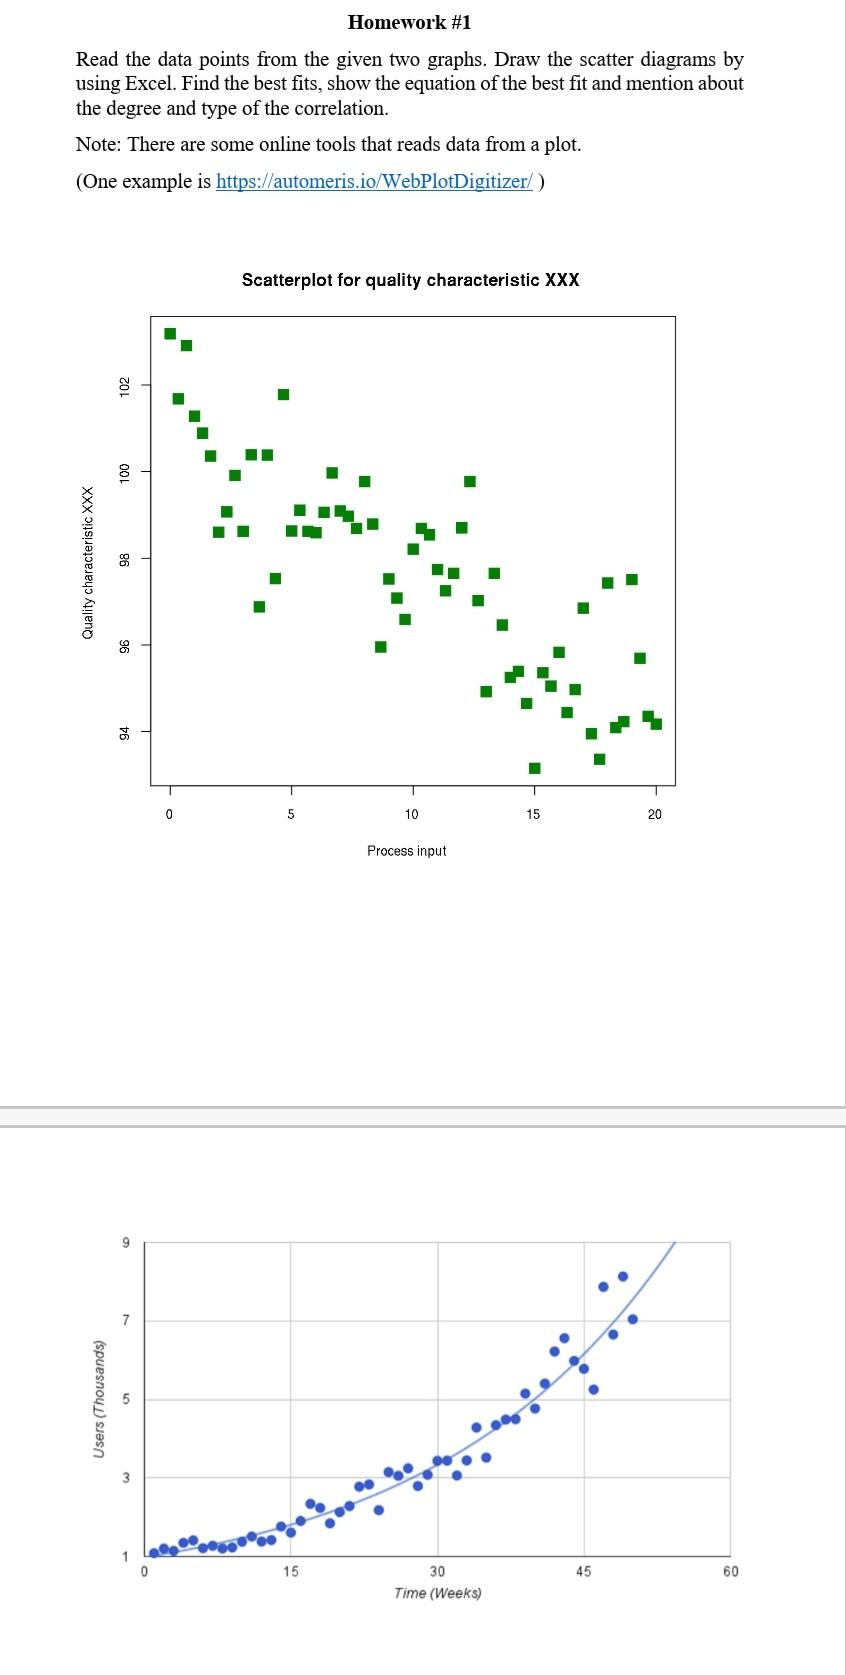
Homework #1 Read the data points from the given two graphs. Draw the scatter diagrams by using Excel. Find the best fits, show the equation of the best fit and mention about the degree and type of the correlation. Note: There are some online tools that reads data from a plot. (One example is https://automeris.io/WebPlot Digitizer/) Scatterplot for quality characteristic XXX 102 100 Quality characteristic XXX 96 94 1 T 1 0 5 10 15 20 Process input 9 7 Users (Thousands) 15 45 60 30 Time (Weeks) Homework #1 Read the data points from the given two graphs. Draw the scatter diagrams by using Excel. Find the best fits, show the equation of the best fit and mention about the degree and type of the correlation. Note: There are some online tools that reads data from a plot. (One example is https://automeris.io/WebPlot Digitizer/) Scatterplot for quality characteristic XXX 102 100 Quality characteristic XXX 96 94 1 T 1 0 5 10 15 20 Process input 9 7 Users (Thousands) 15 45 60 30 Time (Weeks)
Step by Step Solution
There are 3 Steps involved in it

Get step-by-step solutions from verified subject matter experts