

Question: having difficulty with this set of questions for exercise 3. I would appreciate a breakdown. and also I would like An explanation on how to
having difficulty with this set of questions for exercise 3. I would appreciate a breakdown.
and also I would like An explanation on how to interpret Pearson's "r"
thank you!
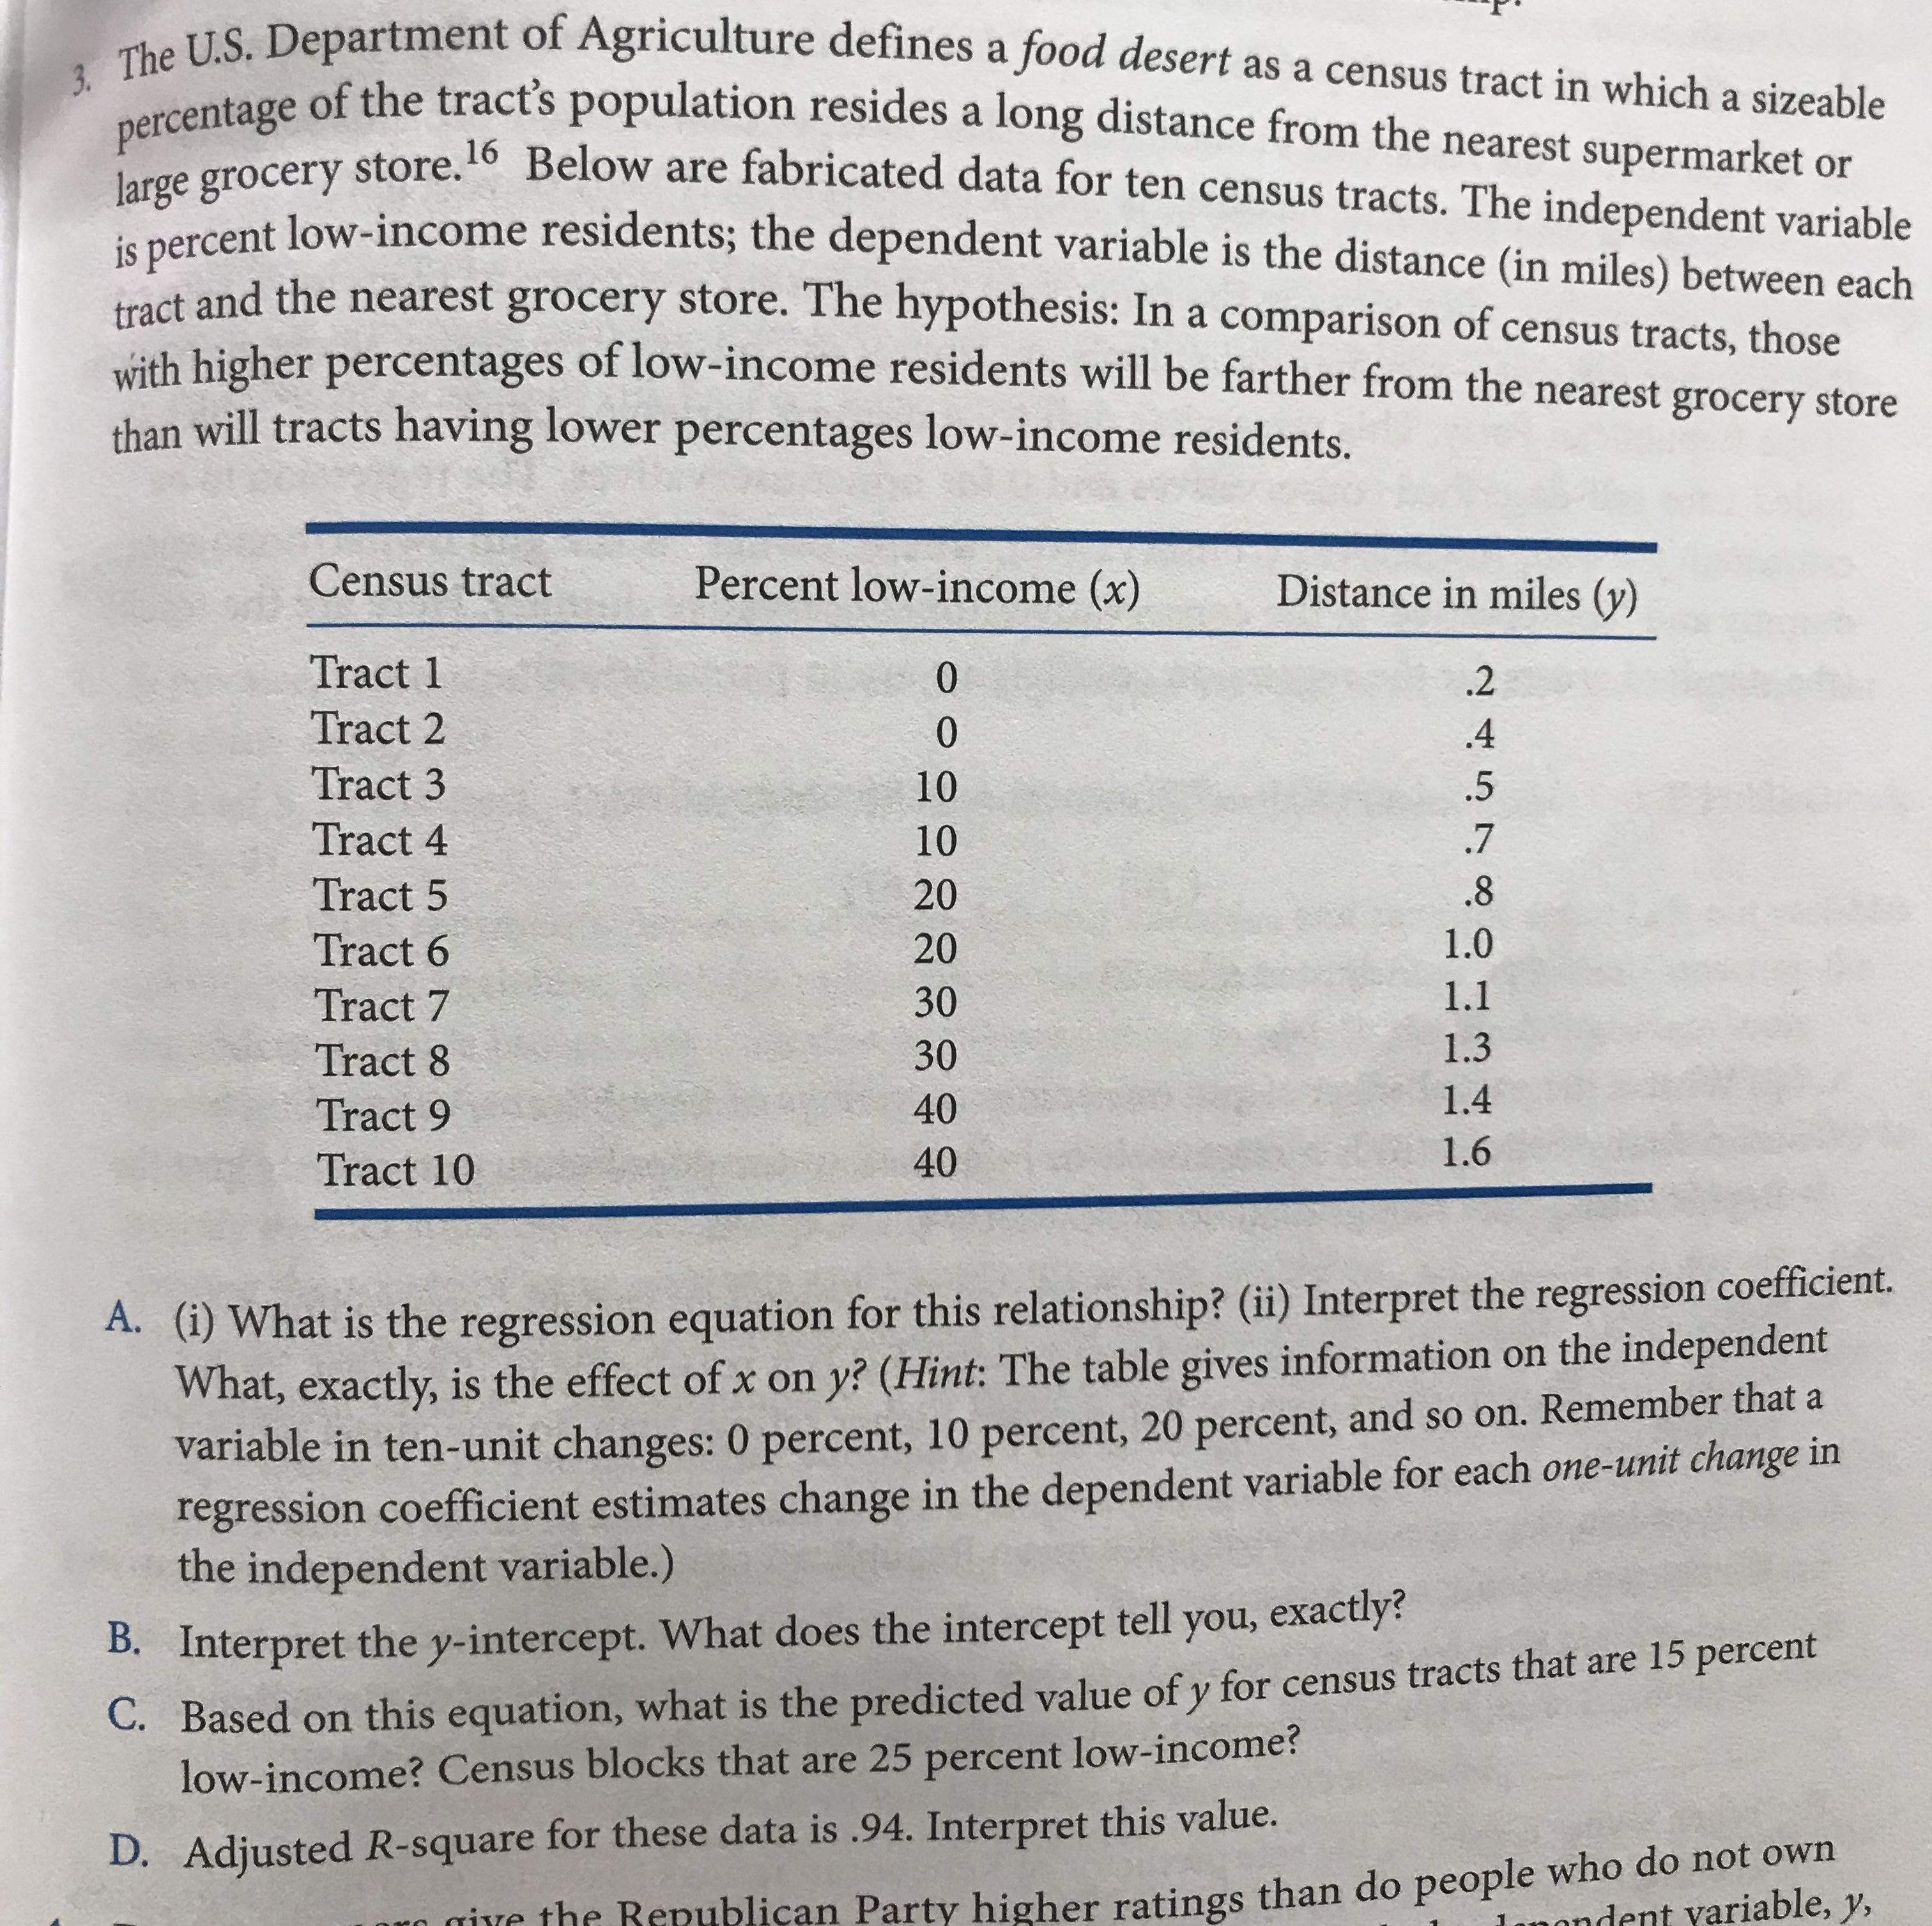
The U.S. Department of Agriculture defines a food desert as a census tract in which a sizeable percentage of the tract's population resides a long distance from the nearest supermarket or large grocery store. " Below are fabricated data for ten census tracts. The independent variable is percent low-income residents; the dependent variable is the distance (in miles) between each tract and the nearest grocery store. The hypothesis: In a comparison of census tracts, those with higher percentages of low-income residents will be farther from the nearest grocery store than will tracts having lower percentages low-income residents. Census tract Percent low-income (x) Distance in miles (y) Tract 1 Tract 2 Tract 3 Tract 4 Tract 5 20 Tract 6 20 :0 0 ' in is N Tract 7 30 1.1 Tract 8 30 1.3 Tract 9 40 1.4 Tract 10 40 1.6 A. (i) What is the regression equation for this relationship? (ii) Interpret the regression coefficient. What, exactly, is the effect of x on y? (Hint: The table gives information on the independent variable in ten-unit changes: 0 percent, 10 percent, 20 percent, and so on. Remember that a regression coefficient estimates change in the dependent variable for each one-unit change in the independent variable.) B. Interpret the y-intercept. What does the intercept tell you, exactly? C. Based on this equation, what is the predicted value of y for census tracts that are 15 percent low-income? Census blocks that are 25 percent low-income? D. Adjusted R-square for these data is .94. Interpret this value. ublican Party higher ratings than do people who do not own + variable, y
Step by Step Solution
There are 3 Steps involved in it

Get step-by-step solutions from verified subject matter experts