

Question: Having trouble getting to the answer for part E. Please show work if possible. Thank You! Score: 0.97 of 1 pt 4 10 of 12
Having trouble getting to the answer for part E. Please show work if possible. Thank You!
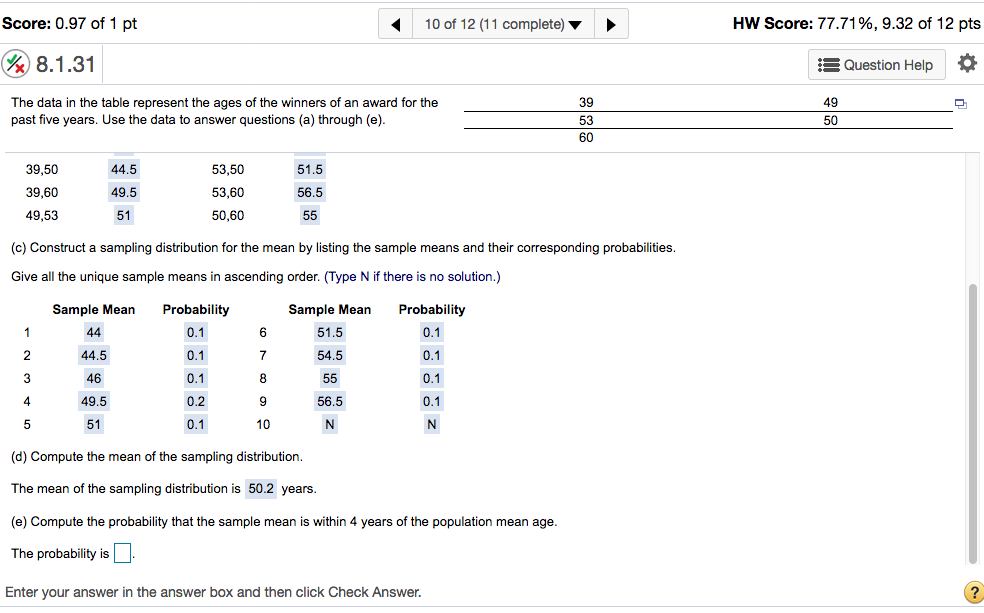
Score: 0.97 of 1 pt 4 10 of 12 [11 complete] 7 } HIV Score: 77.71 9%, 9.32 of 12 pm. @ 3.1.31 5E Question Help g The data in the table represent the ages of the winners of an award for the 39 49 g, past ve years. Use the data to answer questions (a) through {e}. 53 50 60 39,50 44.5 53,50 51.5 39,60 40.5 53,60 56.5 49,53 51 50,60 55 to) Construct a sampling distribution for the mean by listing the sample means and their corresponding probabilities. Give all the unique sample means in ascending order. (Type N ifthere is no solution.) Sample M ean Probability Sample H ean Probability 1 44 0.1 6 51 .5 0.1 2 44.5 0.1 7 54.5 0.1 3 46 0.1 8 55 0.1 4 49.5 0.2 9 56.5 0.1 5 51 0.1 10 N N {d} Compute the mean of the sampling distribution. The mean ofthe sampling distribution is 50.2 years. {9} Compute the probability that the sample mean is within 4 years of the population mean age. The probability is Enter your answer in the answer box and then click Check Answer. @
Step by Step Solution
There are 3 Steps involved in it

Get step-by-step solutions from verified subject matter experts