

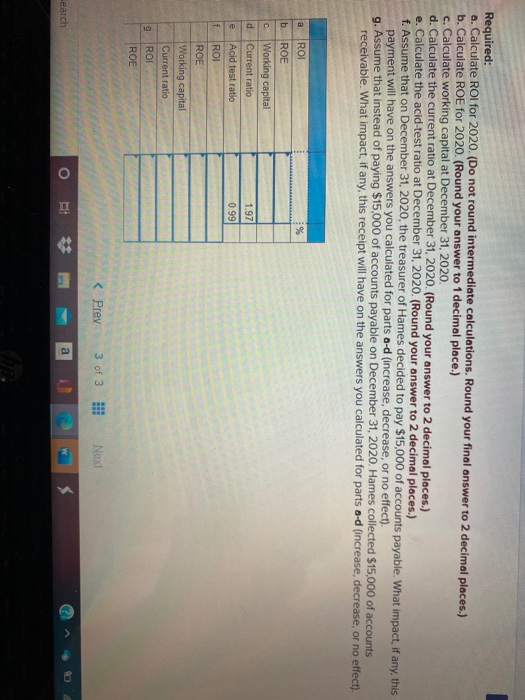
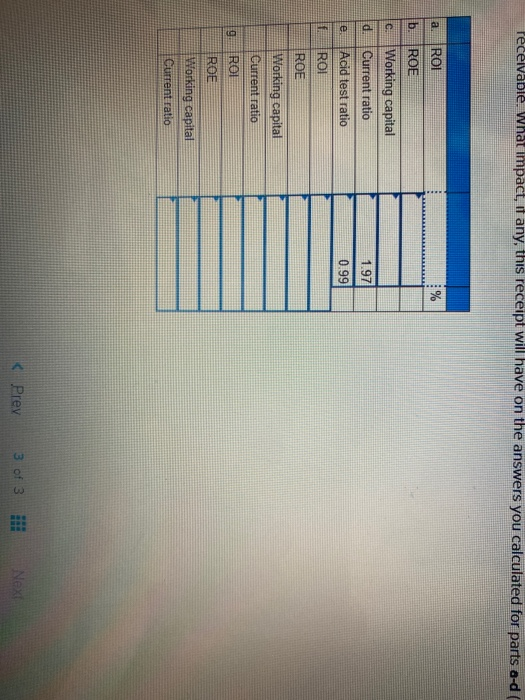
Question: having trouble with a, b, c, f, g Presented here are the comparative balance sheets of Hames Inc. at December 31, 2020 and 2019. Sales
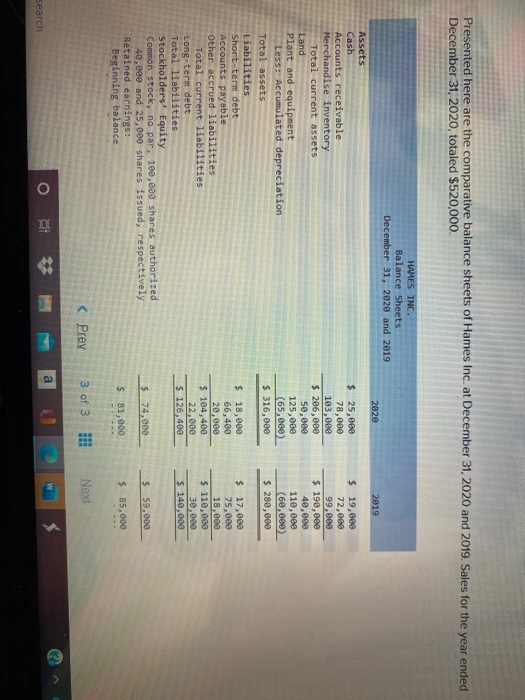
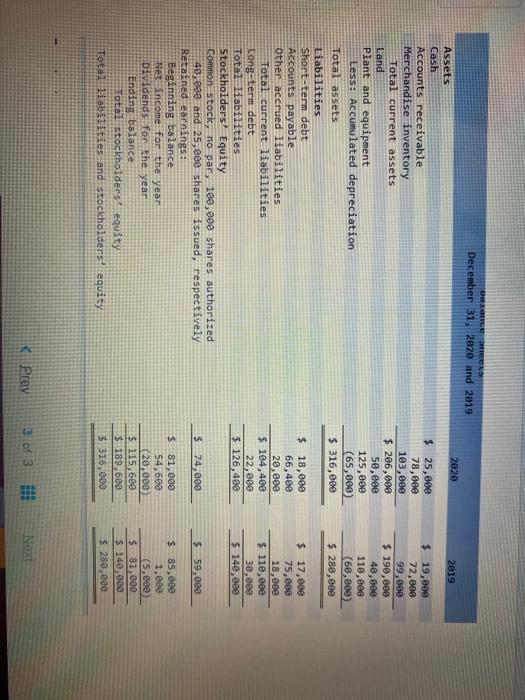
Presented here are the comparative balance sheets of Hames Inc. at December 31, 2020 and 2019. Sales for the year ended December 31, 2020, totaled $520,000. HAMES INC. Balance Sheets December 31, 2020 and 2019 2020 2019 $ 25,000 78,000 103,000 $ 286,000 50,000 125,000 (65,000) $ 316,080 $ 19,000 72,000 99,000 $ 190,000 40,000 110,000 (60,000) $ 280,000 Assets Cash Accounts receivable Merchandise inventory Total current assets Land plant and equipment Less: Accumulated depreciation Total assets Liabilities Short-term debt Accounts payable Other accrued liabilities Total current liabilities Long-term debt Total liabilities Stockholders' Equity Common stock, no par, 100,000 shares authorized 40,000 and 25,000 shares issued, respectively Retained earnings: Beginning balance $ 18,000 66,400 20,000 $ 104,400 22,000 $ 126,400 $ 17,000 75,000 18,000 $ 110,000 30,000 $ 140,000 $ 74,000 $ 59,000 $ 81,000 $ 85,000
Step by Step Solution
There are 3 Steps involved in it

Get step-by-step solutions from verified subject matter experts