

Question: Having trouble with creating excel graphs for the data tables below based off of the steps listed. I have completed the data for data tables
Having trouble with creating excel graphs for the data tables below based off of the steps listed. I have completed the data for data tables 1 and 2. I just need assistance with calculations for data table 3 and the graphs.
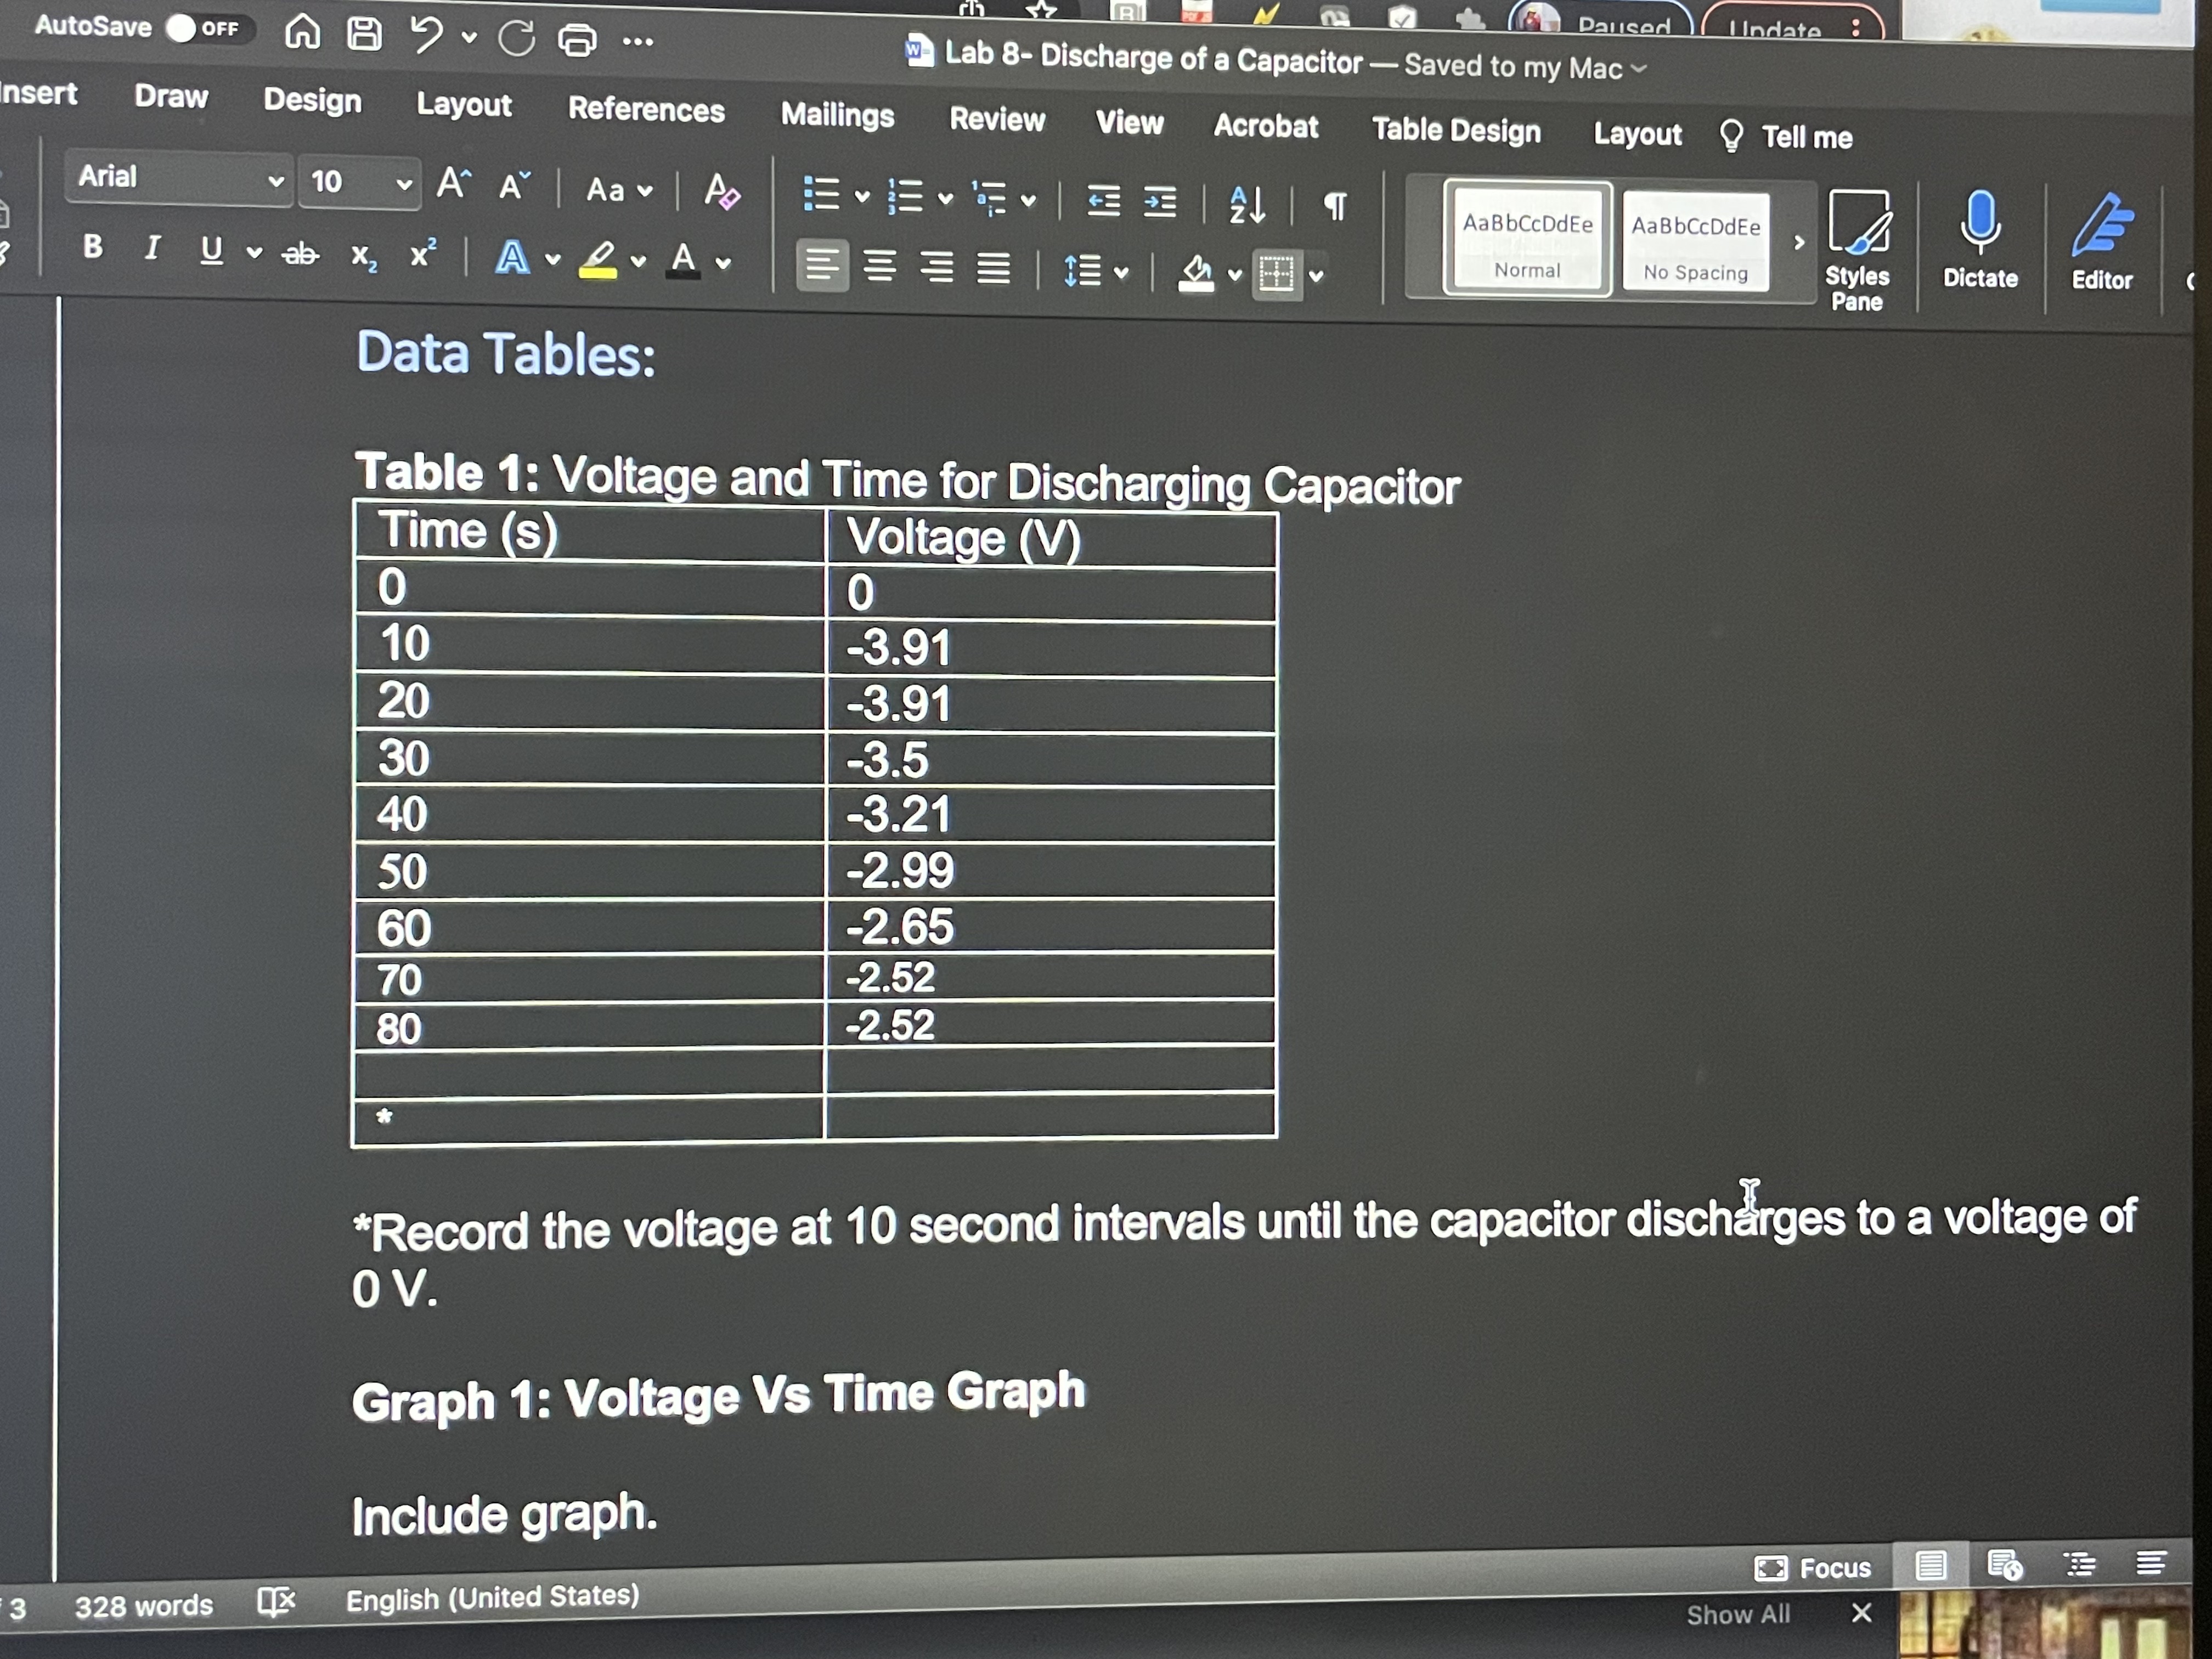
- Record the voltage at 10 second intervals inData Table 1as the capacitor discharges to a voltage of 0 V.
- Use a computer graphing program such as EXCEL to make an x-y scatter plot with the capacitor voltage on the y-axis versus time on the x-axis.
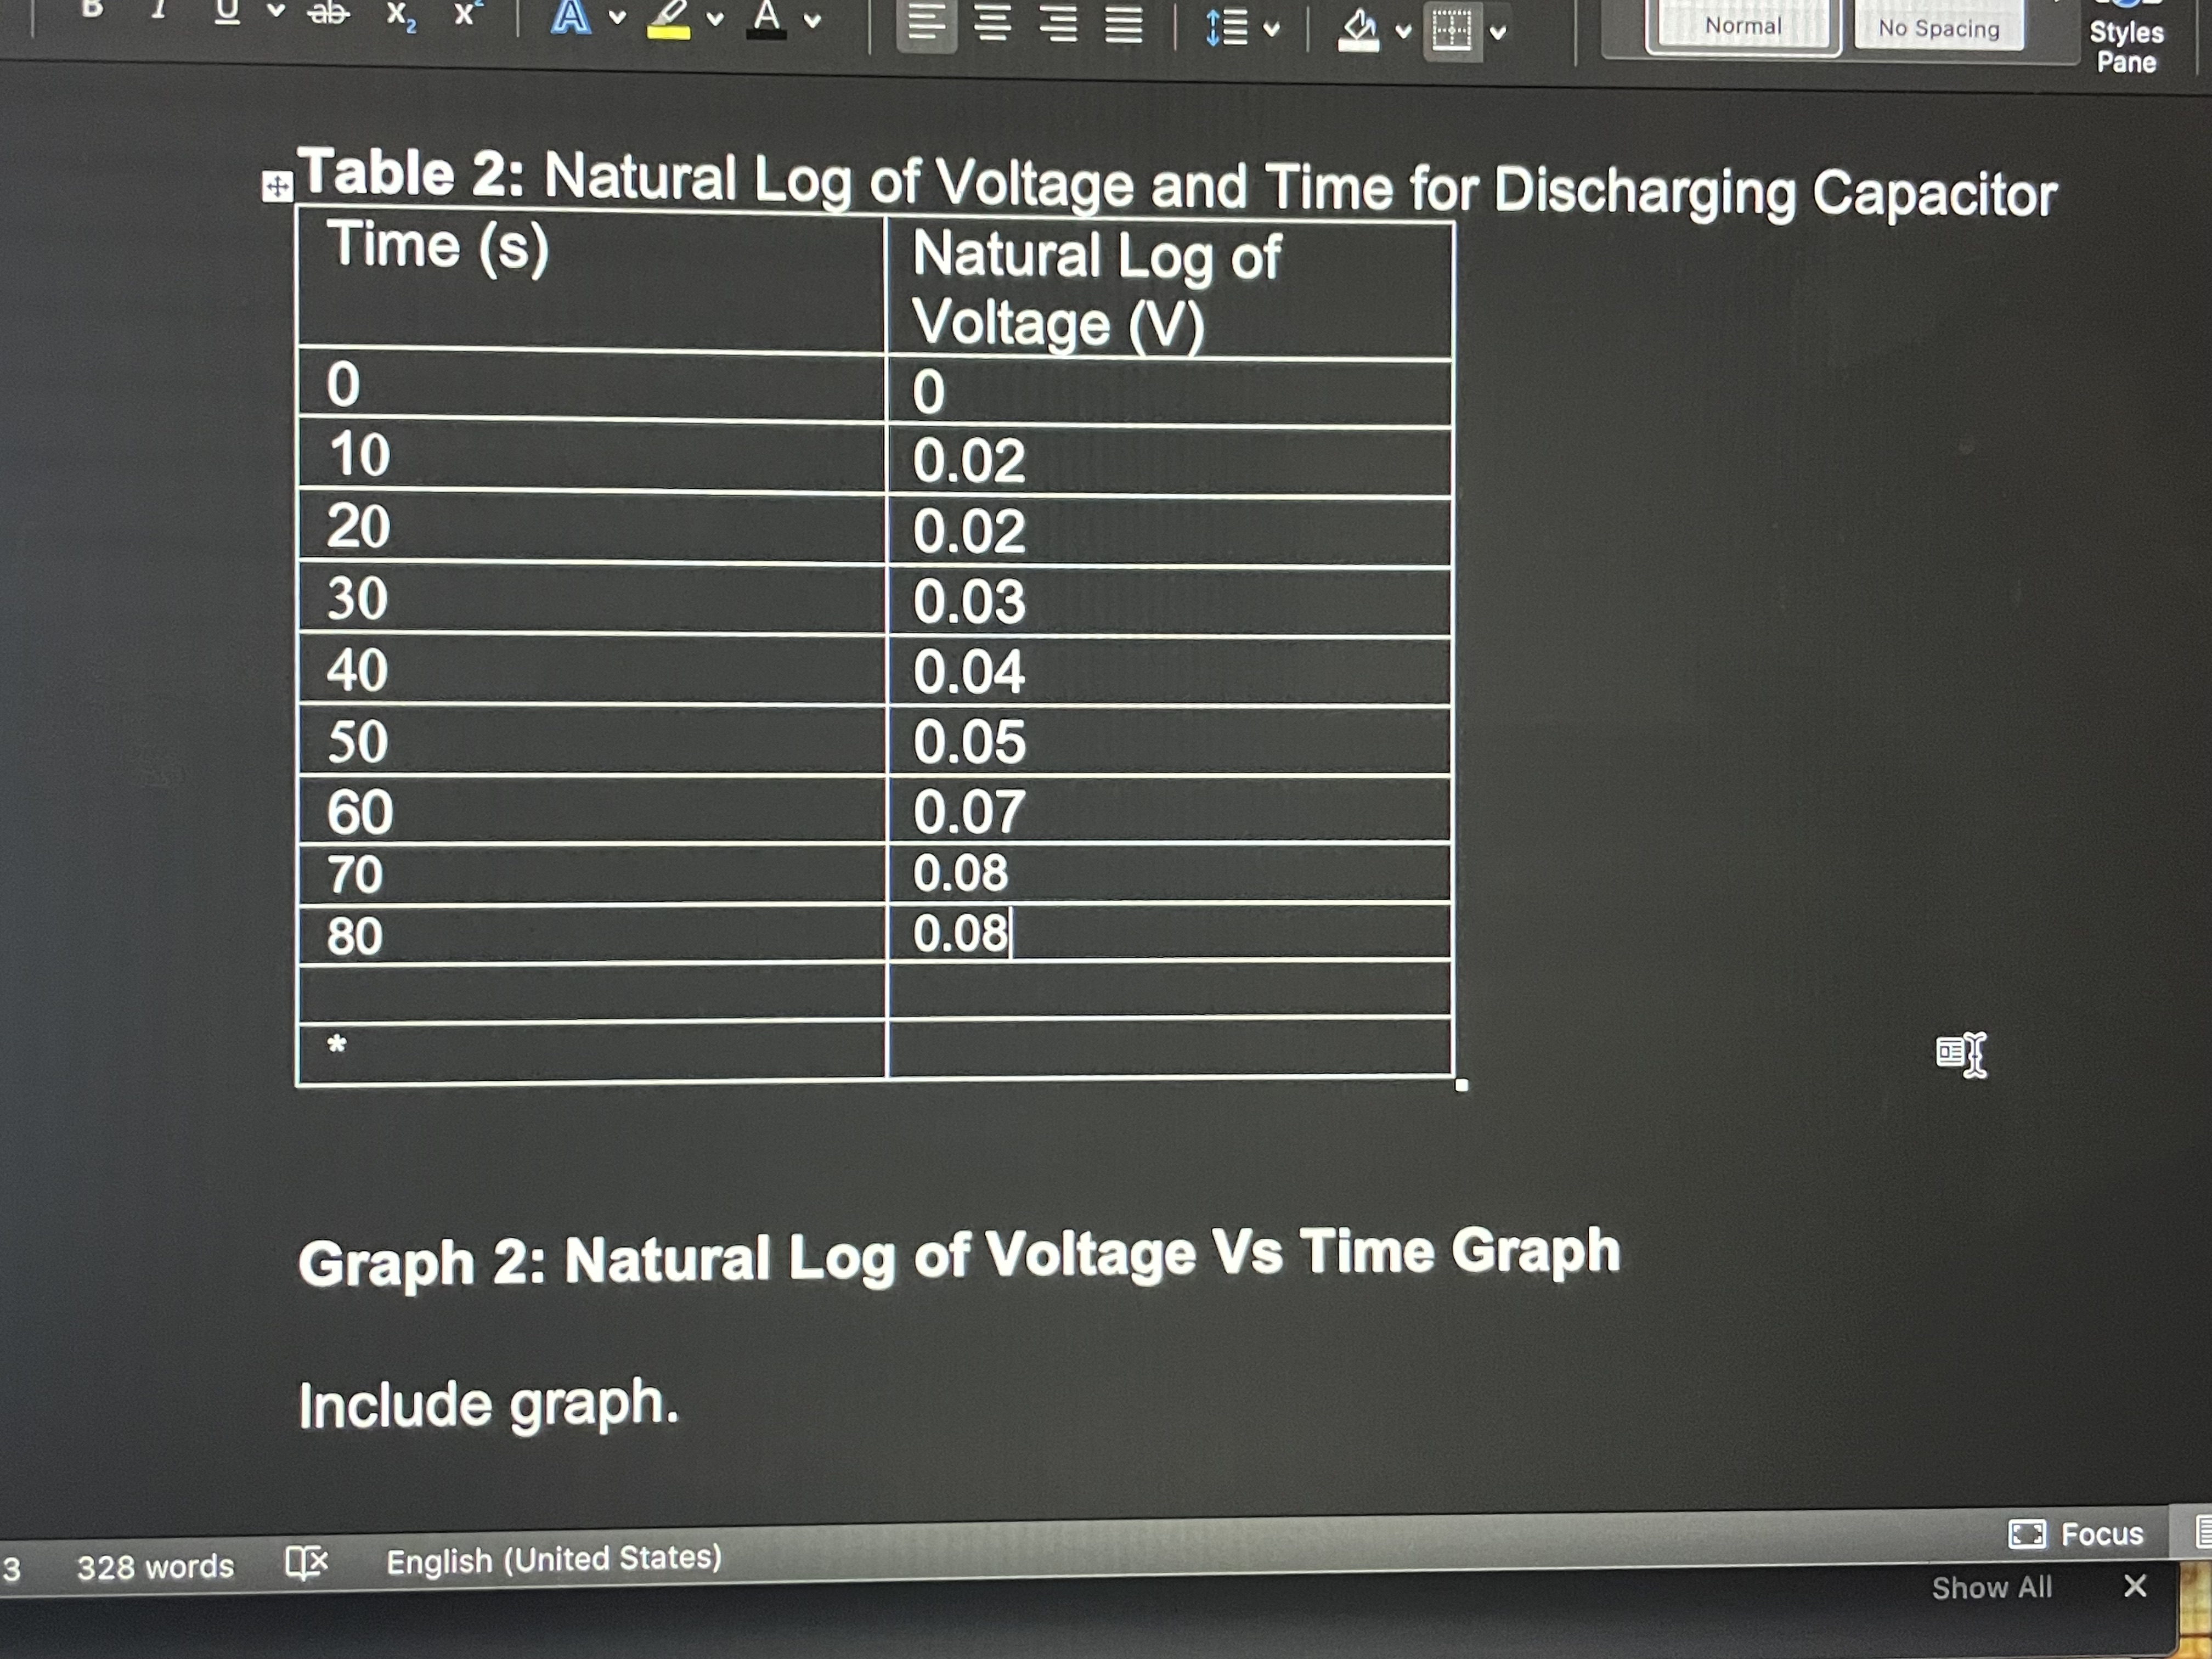
- Calculate the natural log of the capacitor voltage for each time point and record inData Table 2.
- Use a computer graphing program to make an x-y scatter plot with the natural log of the capacitor voltage on the y-axis versus time on the x-axis.
- Add a linear trendline to your graph and display the best fit equation.
Note: Only graph the In(V) value once if it is calculated more than once.
6. Copy the graph asGraph 2 to Data & Analysis section.
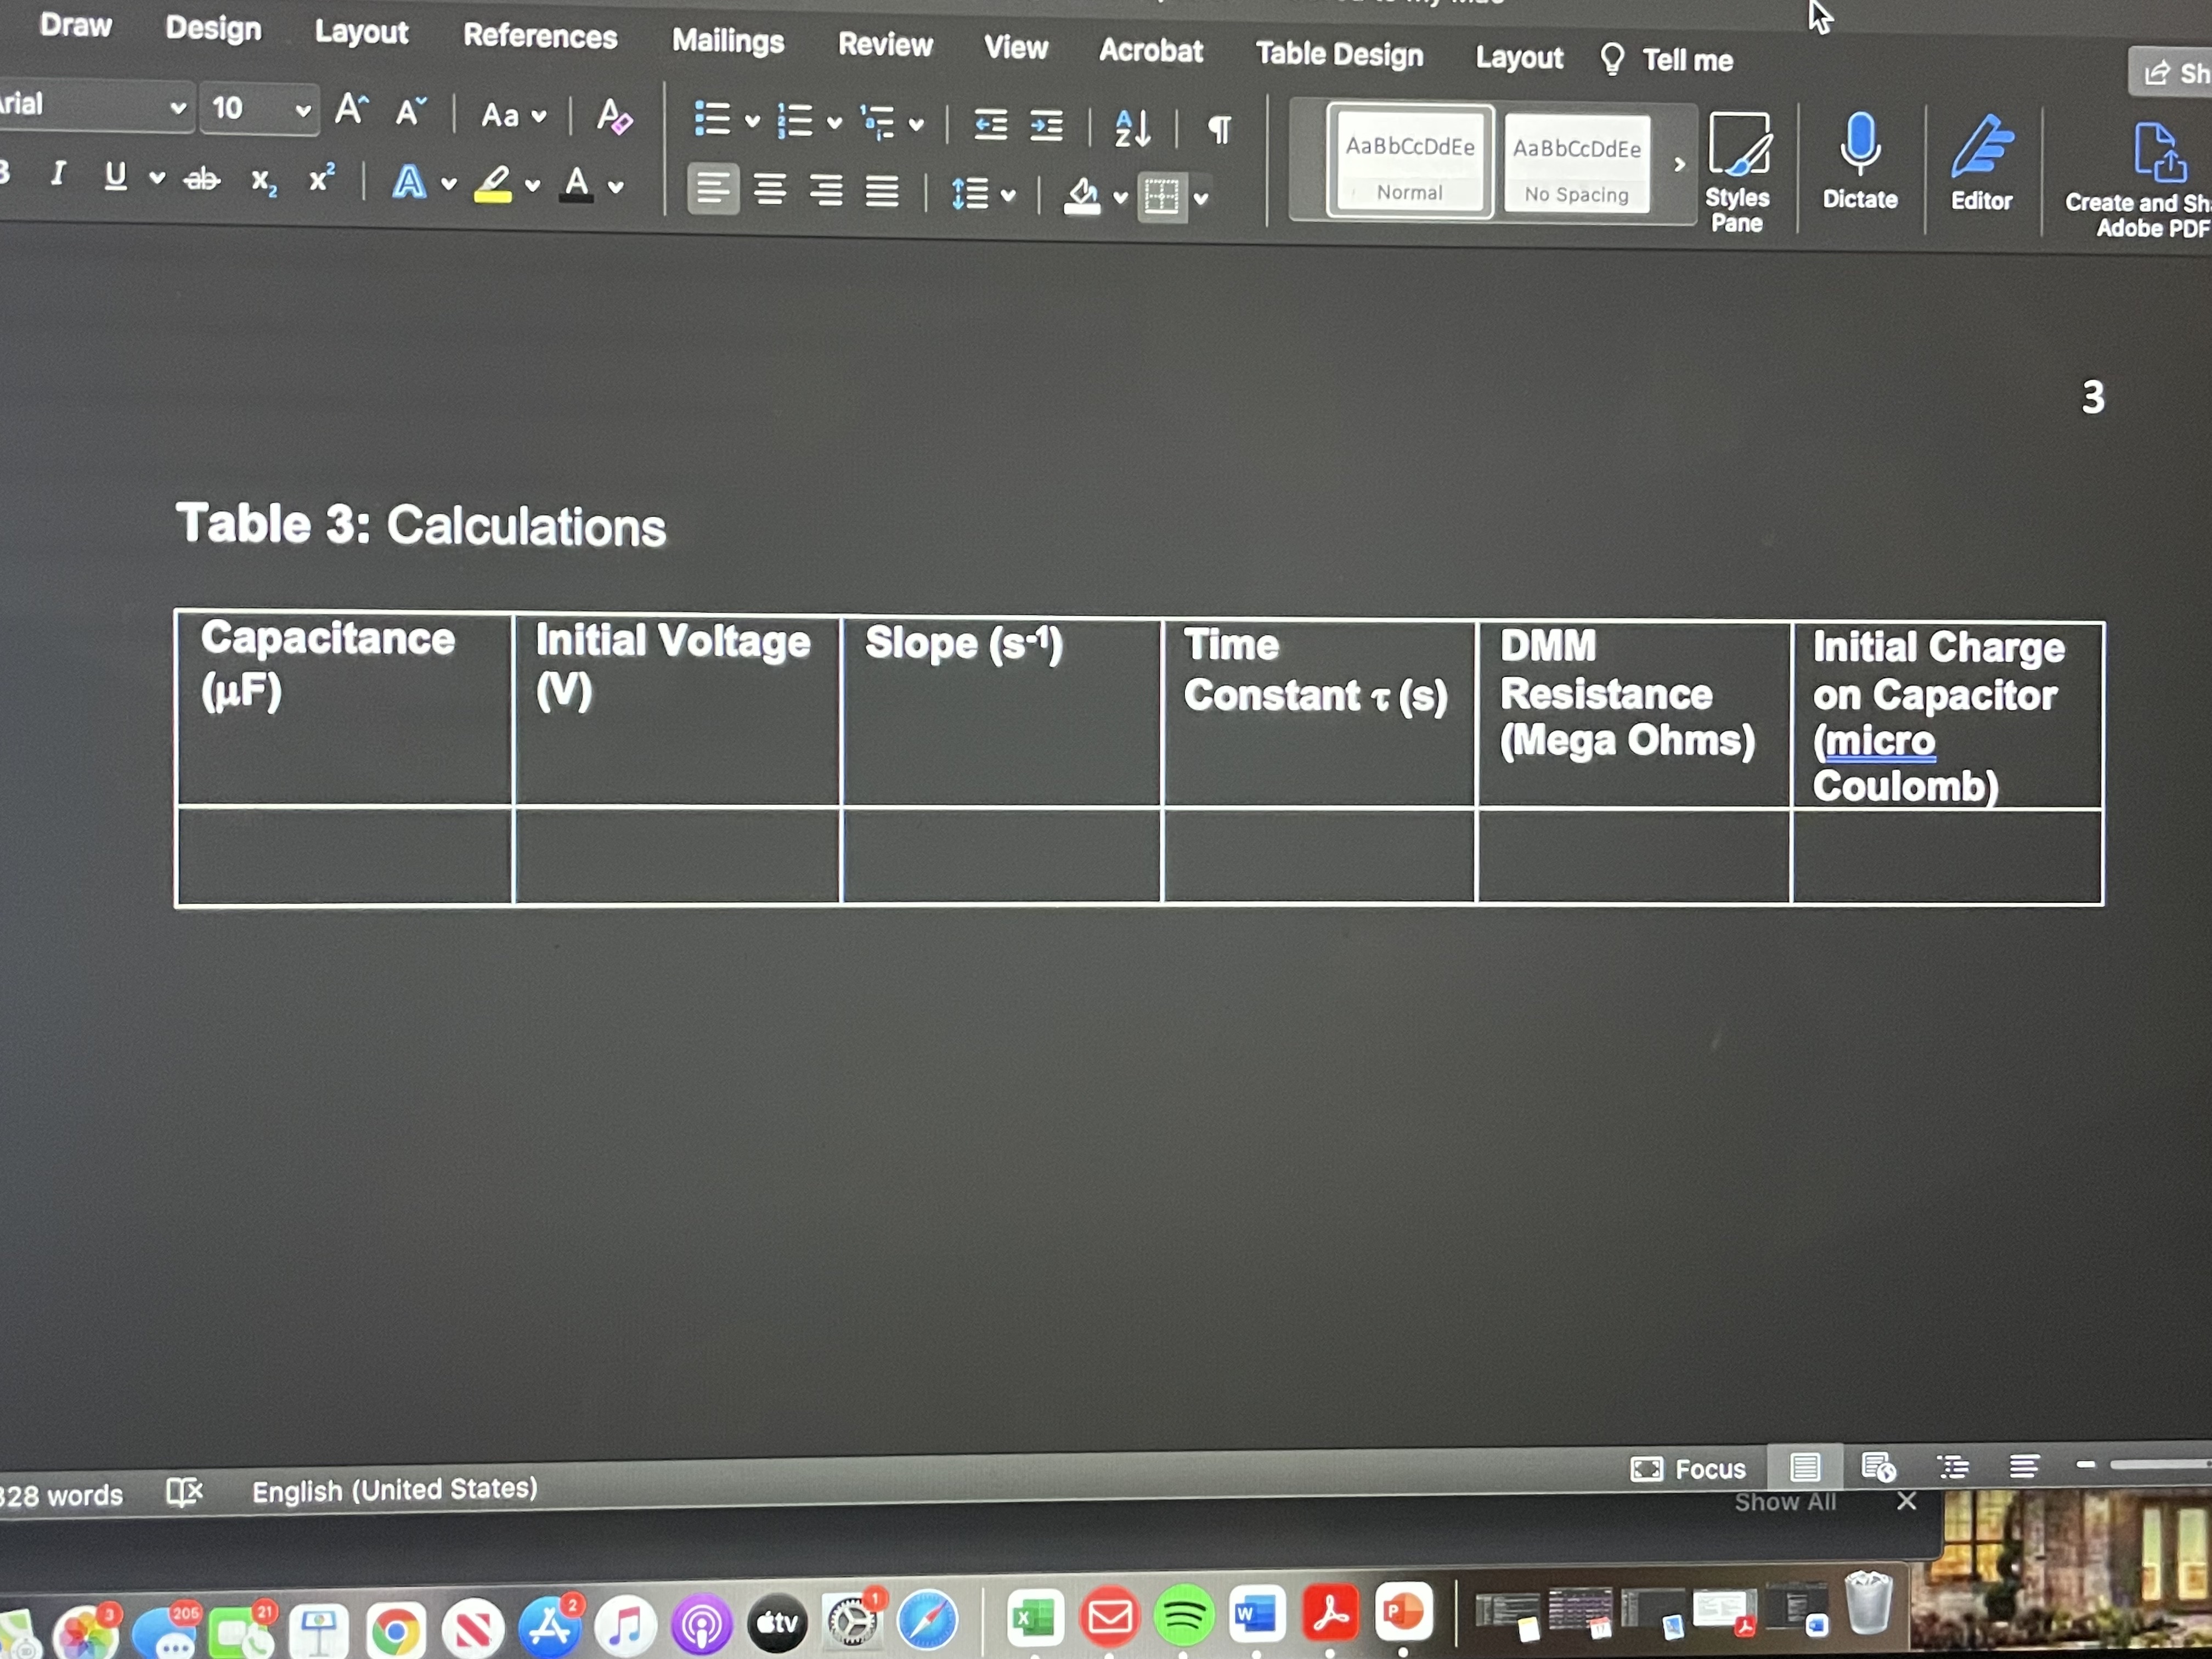
7. Record the capacitance of the capacitor (printed on the side of the capacitor) and the initial voltage (fromData Table 1) inData Table 3.
8. Record the slope from your best-fit equation in step 14 inData Table 3.
9. Calculate the capacitor time constant ? using the slope with the equation:?=?1/slope
10. Record the time constantt value inData Table 3.
11. Calculate the internal DMM resistanceRusing the following equation:?=RC (Note: Use the conversion factor 1 ?F = 10- 6F.)
12. Record the DMM resistance in M? inData Table 3. (Note: Use the conversion factor 1 M? = 106?)
13. Calculate the initial chargeQon the capacitor using the following equation: Q =CV (Note: Values must be in standard SI units (Coulombs, Farads, and Volts).
14. Record the initial charge in ?C inData Table 3 (Note: Use the conversion factor 1 ?C = 10-6C)
( Paused )/ I Indate : AutoSave . OFF A BY CG ... Lab 8- Discharge of a Capacitor - Saved to my Mac nsert Draw Design Layout References Mailings Review View Acrobat Table Design Layout Tell me Arial 10 A A Aa AaBbCcDdEe AaBbCcDdEe BIUvab A v LV Av E E Normal No Spacing Styles Dictate Editor Pane Data Tables: Table 1: Voltage and Time for Discharging Capacitor Time (s) Voltage (V) 0 0 10 -3.91 20 -3.91 30 -3.5 40 -3.21 50 -2.99 60 -2.65 70 -2.52 80 -2.52 * *Record the voltage at 10 second intervals until the capacitor discharges to a voltage of OV. Graph 1: Voltage Vs Time Graph Include graph. Focus Show All X 3 328 words English (United States)AV A Normal No Spacing Styles Pane # Table 2: Natural Log of Voltage and Time for Discharging Capacitor Time (s) Natural Log of Voltage (V) O 10 0.02 20 0.02 30 0.03 40 0.04 50 0.05 60 0.07 70 0.08 80 0.08 Graph 2: Natural Log of Voltage Vs Time Graph Include graph. Focus 3 328 words X English (United States) Show All XDraw Design Layout References Mailings Review View Acrobat Table Design Layout ? Tell me LE S rial v 10 A A Aav Ap AaBbCcDdEe Aa BbCcDdEe 0 I Uvab X X Av " Ov Av E E E Normal No Spacing Styles Dictate Editor Create and Sh Pane Adobe PDF 3 Table 3: Calculations Capacitance Initial Voltage Slope (s-1) Time DMM Initial Charge (UF) () Constant T (s) Resistance on Capacitor (Mega Ohms) (micro Coulomb) Focus = 28 words LX English (United States) Show All 205 21
Step by Step Solution
There are 3 Steps involved in it

Get step-by-step solutions from verified subject matter experts